
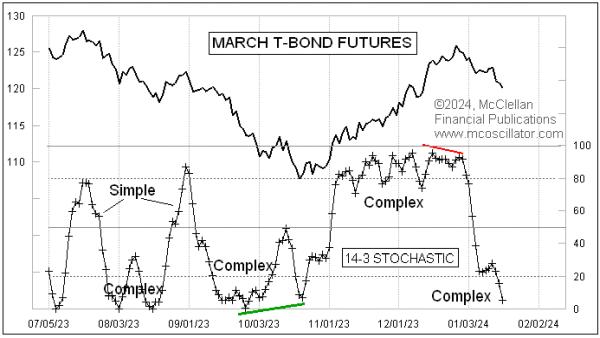
Here is a fun magic trick that some technical indicators can do. This week's chart shows the 14-3 stochastic oscillator for T-Bond futures prices -- 14-3 means a 14-trading-day lookback period and a 3-day simple moving average for smoothing. Right now, this indicator is forming a "complex" structure below the 50 neutral level, and that carries a message that the bears are in charge at the moment.
By "complex", I mean that there has been some chopping up and down without a crossing of the neutral level. This differs from a "simple" structure, which moves across the neutral level and back without developing any complexity. A simple structure implies weakness for the side of neutral on which it is seen.
The message of control from a complex structure persists until there is a divergence versus prices, such as the two divergences highlighted in the chart above. During November and December 2023, there was a big complex structure above the 50 neutral level, indicating that the bulls were in charge, and it was a good message. But that message changed at the end of December 2023, when there was a bearish divergence versus prices, which signaled that the period of bulls being in control was ending.
The current structure below the 50 neutral level is a complex one, and, thus far, does not have a divergence versus prices, so the message is that the bears are in control in the bond market until further notice.
This trick of having complex or simple structures making a statement about which side is in control is also something that the McClellan A-D Oscillator can do.
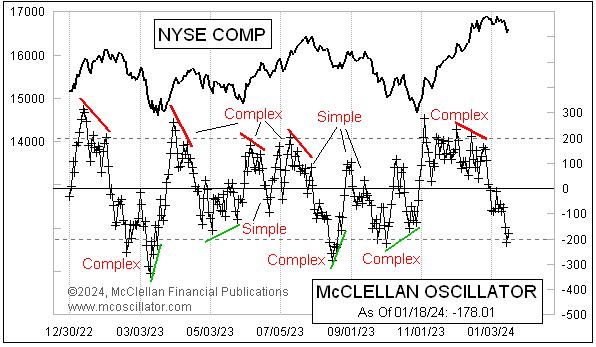
I have labeled some of the structures in this chart as complex or simple to help you get the idea. The most recent structure above the zero neutral level was a complex one, saying that the bulls were in charge of the stock market during November and December 2023. That message changed when the oscillator stopped making higher highs, and there was thus a bearish divergence versus prices. The current structure below the zero neutral level is a complex one, and even though it is down to an oversold level, it has not yet shown us a bullish divergence versus prices. So the message of the bears being in control stands, for now.
Not every technical indicator will perform this magic trick, so the reader should not assume that it is a universal property of all indicators. But it is a fun one to find in those indicators for which this trick does work.