
January has long been considered one of the stronger months for the stock market from a seasonal perspective. But this is only true if you average together price data going back many decades. More recent years have shown us a different story.
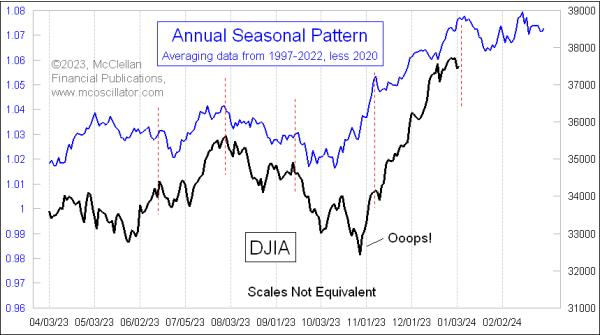
This week's chart shows an Annual Seasonal Pattern for the DJIA using data only since 1997. I have excluded 2020 from the computation of this average pattern, because that was such an unusual year, what with the COVID Crash and the Fed's QE4 response, that it does not really represent what an "average" year looks like. We similarly would not want to depict the "average" sea level on a tidal gauge by including data from a day when an asteroid falls into the ocean.
This version of the DJIA's Annual Seasonal Pattern (ASP) shows a meaningful January dip, lasting until about January 24. This is different from how the market used to behave. For comparison, here is that same Annual Seasonal Pattern versus one calculated on data from 1976 to 1996.
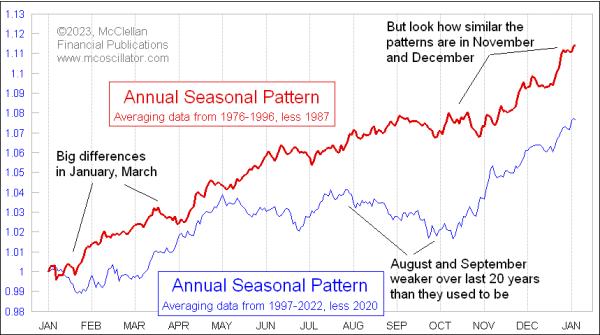
Similar to the way I excluded 2020 from the more recent ASP, I also excluded 1987 from that earlier one, because the crash that year bends the curve so much that it creates a misleading representation. I view this as similar to how Olympic judges in diving and figure skating competitions throw out the top and bottom marks.
The earlier version of the ASP shows that January used to be a strongly up month for the stock market. Now, not so much. Similarly, the month of March used to be rather sideways, but more recently it has been a strong up month. There are also big differences in how the months of August and September have been weaker lately, and how the big seasonal bottom has shifted to earlier in October than it used to arrive.
In other words, anyone using seasonal tendencies in analysis should be aware that not only do individual years vary from "average", but we also see that "average" itself can change over time.