Technology has outperformed every other sector over the past year - except for healthcare. So it begs the question - is there any more gas left in the technology tank? We've seen money rotate to various sectors throughout the past year. Most of the industry groups within technology remain bullish on their longer-term charts, either having broken out recently out of bullish technical patterns or potentially setting up to do so. Let's focus first on the former category.
Consumer electronics ($DJUSCE) and electrical components & equipment ($DJUSEC) are two of the better looking industry groups currently. First take a look at the DJUSCE:
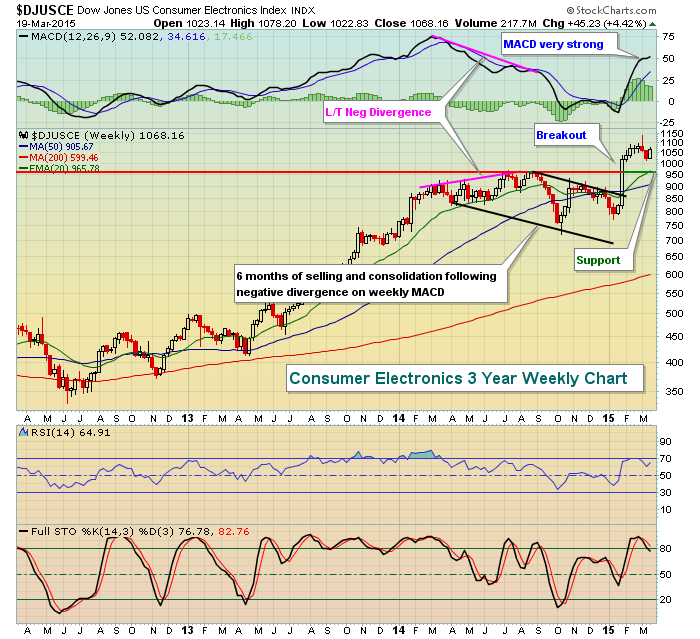
The DJUSCE was channeling lower for six months after an extended two year uptrend left the group with long-term momentum issues, as evidenced by the long-term negative divergence. Once the consolidation period ended in early 2015, the DJUSCE began to lead technology again. The breakout is encouraging for further price appreciation, but the best time to consider entry into the group would be on a period of selling to perhaps test price support closer to 960.
Next up is the DJUSEC where a bullish inverse head & shoulders pattern formed on the heels of its long-term negative divergence. Check it out:
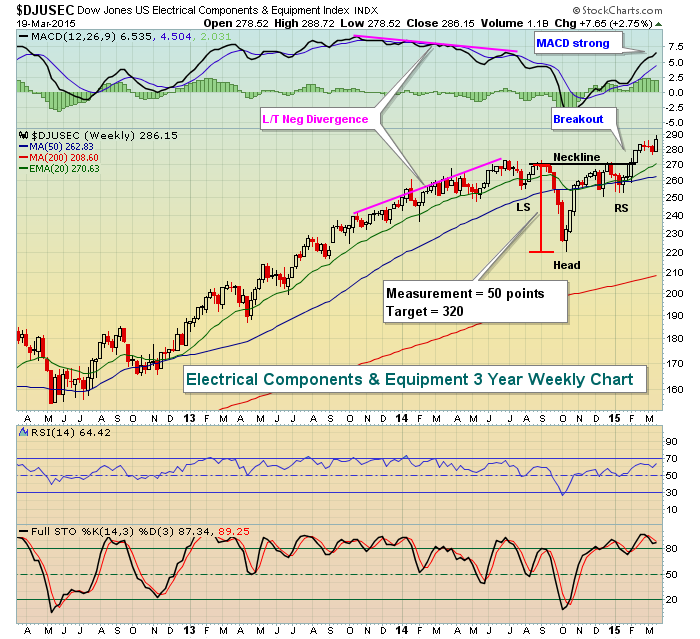
The breakout in early February now sets a target of 320 based on the breakout level of 270 plus the measurement of 50 points. Similar to the DJUSCE, a brief period of selling to test price support at 270 would represent a solid reward to risk entry into the group. Time will tell whether we get it.
That brings me to three technology industry groups that look quite bullish, but are awaiting breakouts to further fuel a rise in technology shares. If you're trading the technology ETF (XLK) and looking for more out of your long position, you'll want to watch these next three groups very closely. First up is the internet space ($DJUSNS). Greg Schnell wrote an excellent piece on Facebook (FB) in the DITC blog yesterday, illustrating its breakout on Thursday. That's helping the group, but a breakout in the industry group has yet to be made. The following chart clearly depicts what's required:
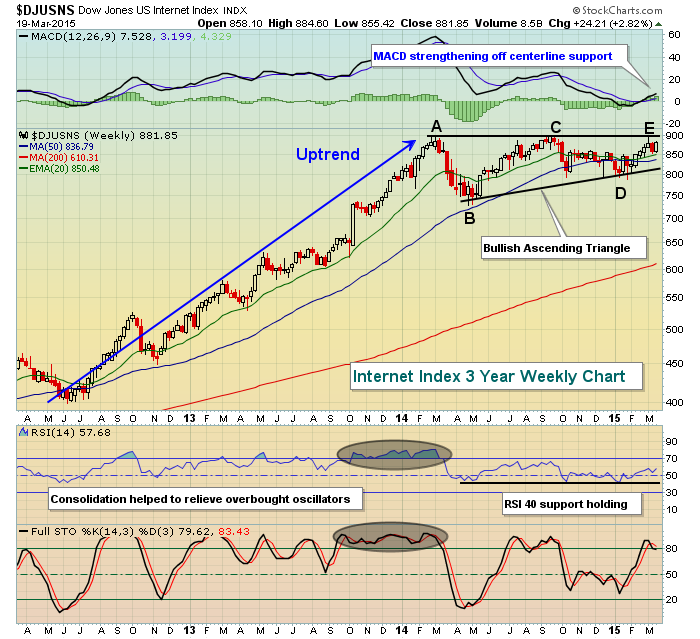
A breakout above 900 would measure to approximately 1075, close to an additional 20% above the breakout. Stocks like Facebook (FB), Google (GOOGL) and Twitter (TWTR) would likely be among the beneficiaries.
IBM's earnings debacle back in October put a ceiling in for computer services ($DJUSDV) stocks, but the group has been rising of late despite the technical weakness in Big Blue. Furthermore, IBM is beginning to see a positive shift in its momentum and if it prints a new low, it'll likely be accompanied by a long-term positive divergence on its weekly chart, a positive for computer services stocks in general.
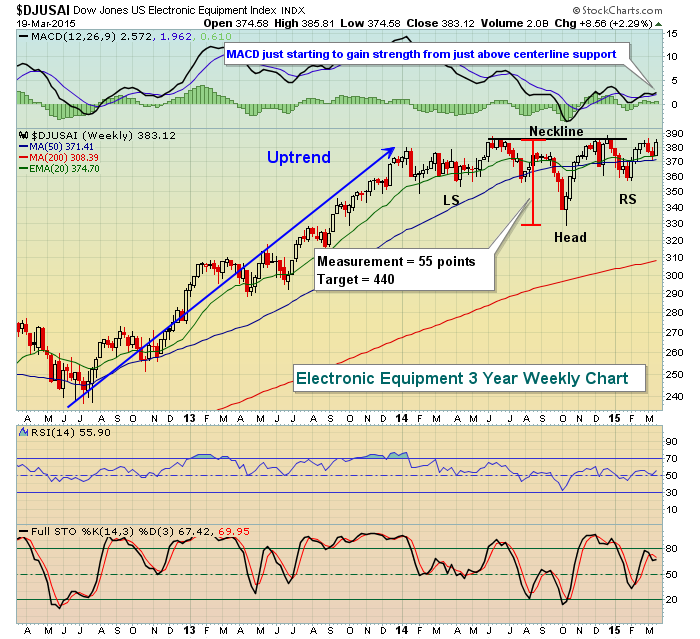
Finally, electronic equipment ($DJUSAI) stocks had very strong days on Monday and Wednesday this week and are on the cusp of an inverse head & shoulders breakout that would measure another 17% or so higher. Technically, I would have liked to have seen the high established in early 2014 as the neckline should not be the price high, but this pattern is quite symmetrical and worth mentioning. Check it out:
In my Trading Places LIVE webinar today at noon eastern, I plan to review all of the technology industry group charts and look at several bullish stocks within these groups. I'll also discuss managing risk by allowing technically solid stocks to sell off to key support levels before entering. Finally, "Free For All Friday" is back, where I'll answer individual stocks questions. Let's see how many I can cover today! You can register for the event HERE.
Happy trading!
Tom


