While most of the U.S. stock market enjoys quite a bull market dating back to March 2009, that's not the case currently for exploration and production stocks ($DJUSOS) - at least not in the near- to intermediate-term. A topping head & shoulders pattern confirmed in late November as neckline support was lost on very heavy volume. In February we saw temporary relief as the neckline breakdown was back tested (red arrow below), but ultimately failed. So the obvious question at this point is "has the bottom formed"? I don't believe it has, but the index is nearly 30% lower now than it was nine months ago so value investors are certainly more interested at this level. Technically, however, I'd remain quite cautious for now. My first problem here is that the H&S pattern has not yet made its measurement. On topping H&S patterns, I measure the pattern based on the percentage difference between the top of the head and the neckline. I realize that necklines can vary based on whether you connect intraday/intraweek lows or closing lows, or even some combination of both. But we should be able to predict an area where we'd be satisfied the pattern was complete. First, take a look at the 3 year weekly chart of the DJUSOS:
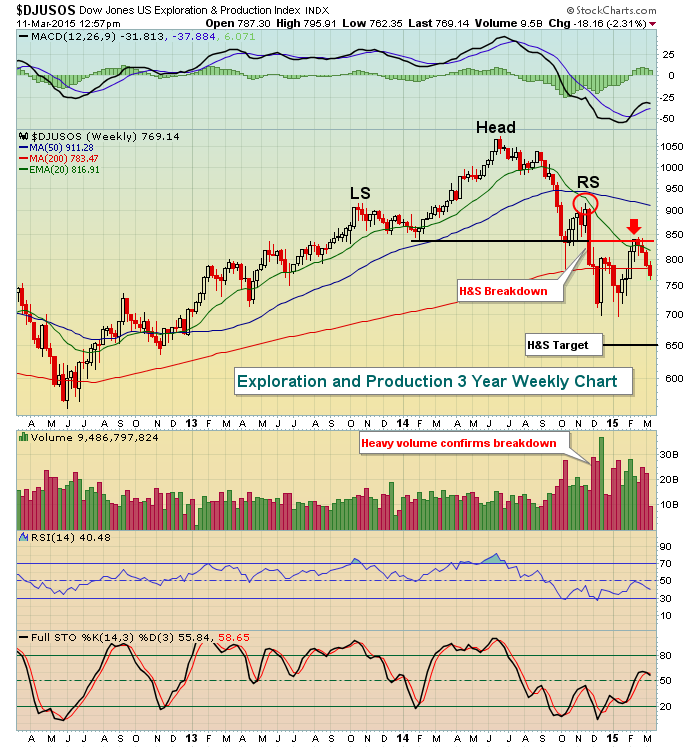
From the chart, the head is approximately 1075 and the neckline is roughly 835. The difference of 240 points divided by the head of 1075 suggests a further drop of 22.3%. From the neckline of 835, that would represent a decline of 186 points, which would potentially send the DJUSOS down to the 650 area. That price level would make sense technically for a couple of reasons. First, you'll see on the next 10 year weekly chart that trend line support (green line) is approaching that price level. Second, if we do see this index forge to new lows, it's quite likely there'll be a weekly long-term positive divergence to accompany it, suggesting that downward price momentum is slowing. Check it out:
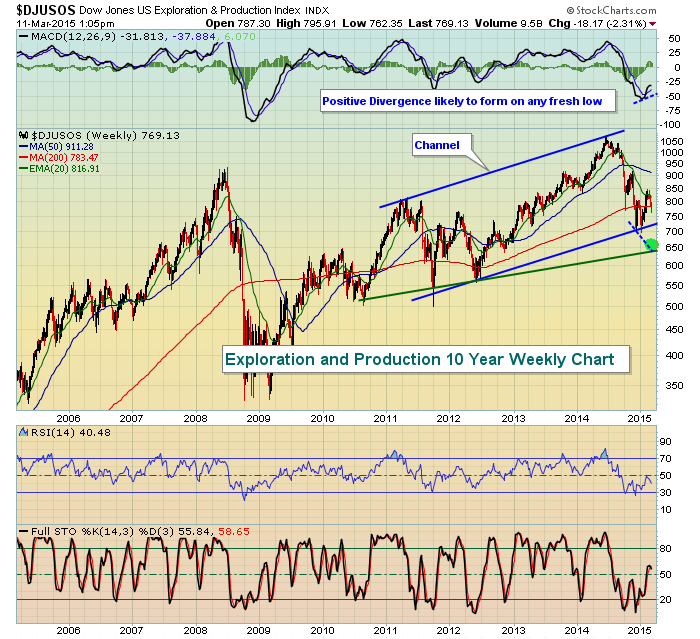
As you can see from the blue channel lines above, a technical argument could be made that the bottom has already formed and I wouldn't necessarily disagree with that assessment so long as bottom channel line support holds. If it breaks, though, the 650 support level comes into play based on that head & shoulder measurement. It would seem to me that the two best reward to risk levels for long entry into this space would be at channel support, currently near 725, and trend line support closer to 650.
Among individual stocks in this space, Apache (APA) looks interesting on its weekly chart and could benefit from one more push to the downside in price. Take a look:
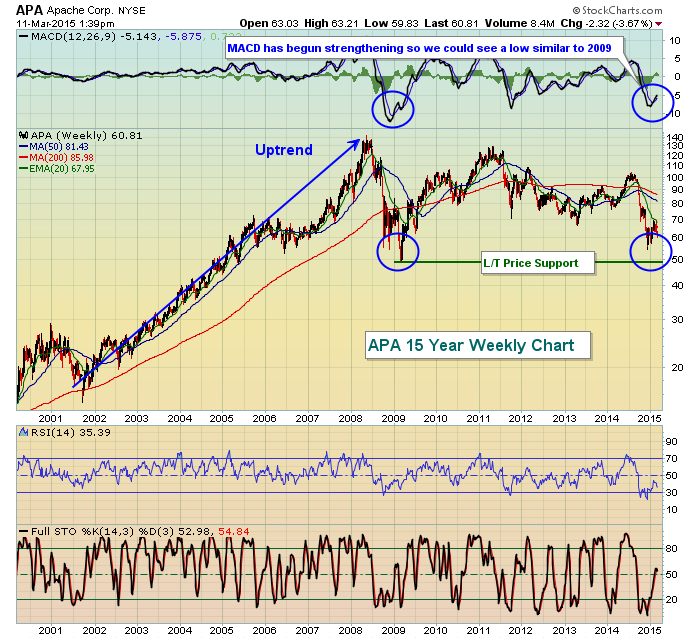
The reward to risk scenario really begins to improve on APA as it moves closer and closer to the 50 support level. Weekly MACD has already turned higher, much like it did in late 2008. Note that APA made one final move lower in early 2009 before rising 150% over the next two years. There are no guarantees that the price support of 2009 will hold as support now, but the reward to risk certainly provides a nice opportunity on the long side, with a fairly tight stop in place.
One last thing that must be mentioned when discussing this space - the U.S. dollar ($USD). From the next chart, it's easy to see there's a clear negative correlation between the $USD and the Exploration and Production index ($DJUSOS):
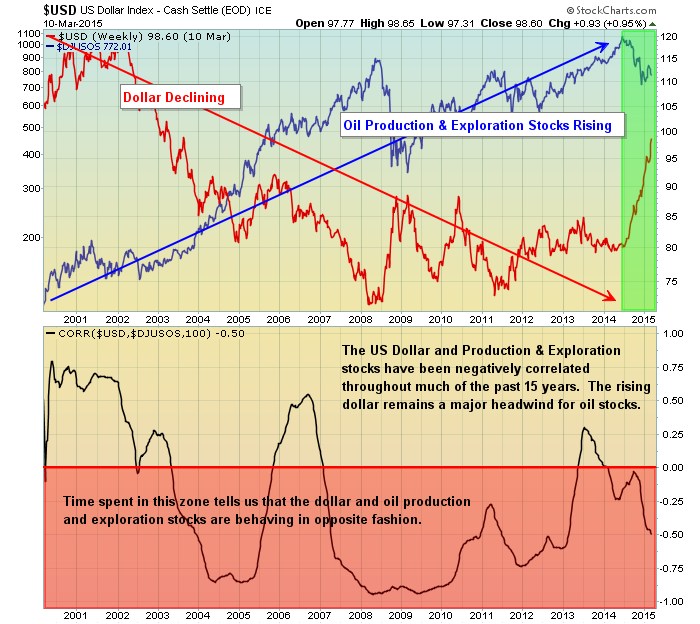
The correlation indicator is designed to track any two ticker symbols to see if they tend to have a positive correlation (move together) or negative correlation (move opposite). The standard number of periods used with the correlation indicator is 20. But I've increased that number to 100 here to illustrate that over longer periods, the U.S. dollar and exploration and production stocks tend to perform opposite one another. The green shaded area at the right side of the last chart shows how the dollar has exploded higher and the clear negative ramifications that's had for the DJUSOS.
In summary, if the DJUSOS hits a price area that is technically attractive at the same time the dollar is showing signs of topping, the attractiveness of the energy sector in general, and the DJUSOS more specifically, grows immensely.
Happy trading!
Tom Bowley


