I discussed how using the MACD in concert with price/volume can be instrumental in making a high probability exit in Parts 1 and 2. Today, I want to focus on candlesticks. I'm a fan of Steve Nison's and have read his books on candlesticks. The idea of reversing candlesticks has always appealed to me because the role of market makers shifts from being long-oriented to short-oriented and high volume reversing candlesticks can alert us to this change in strategy. My philosophy is to trade with the trend. If a market is rising, why do I want to spend my time searching for short candidates that will defy the odds of higher stock prices? The trend is my friend for sure. But as markets rise, they invariably will pull back and consolidate over periods of time. Even if the overall stock market continues pushing higher, sectors and industry groups will take their turns resting in consolidation or continuation patterns. So I try to keep my money at work with groups of stocks that have strong reward to risk (R2R) characteristics and when that R2R changes, as a trader I need to be prepared to change with it.
In an uptrending market, the reversing candles that I look for are typically the shooting star, dark cloud cover, bearish engulfing and black candles. There are others, but those are four of my favorites. Other technical signs that support those reversing candles clearly matter as well. Let me provide you a couple examples of what I look for. Here's Example 1 - ABBV:
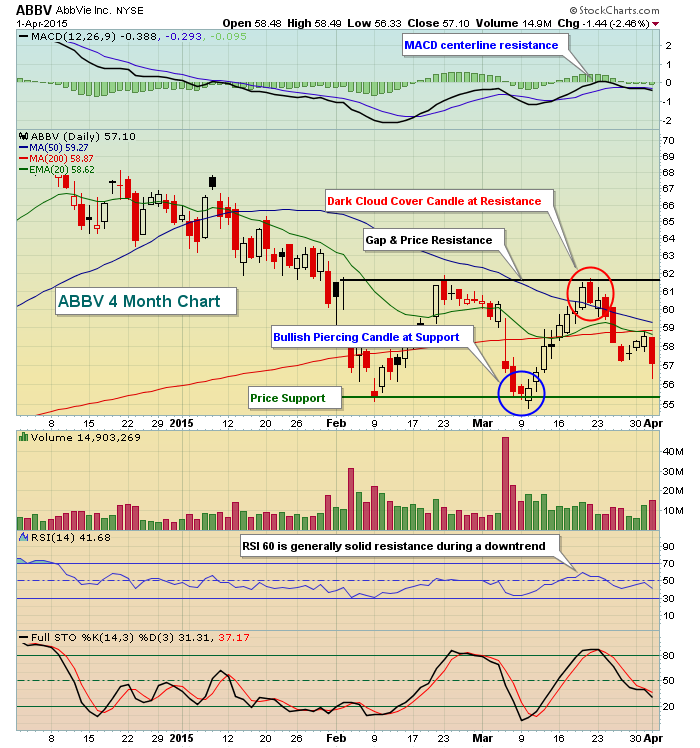
On March 20th, ABBV had moved up unabated for two weeks and tested its February 23rd high. This marked gap resistance in addition to price resistance. Note the MACD was at centerline resistance, RSI had tagged 60 and a reversing candle (dark cloud cover) printed. These were all signs that suggested the odds were growing in favor of the bears. That didn't provide a guarantee that the stock was heading lower, but probabilities were increasing. Nothing ever provides us a guarantee, but you have to approach your trading strategy with a reward to risk perspective. On March 20th, we had little room for further gains unless a breakout was made. I don't want to assume we'll get the breakout, especially given the multi-month downtrend in play here. So the rational decision was to sell on March 20th, take profits and generate cash, looking for another trading opportunity elsewhere. As a side note, check out the piercing candle (bullish cousin of the bearish dark cloud cover candle) on March 10th that reversed the prior downtrend at price support. Reversing candles can be used on both the buy and sell sides.
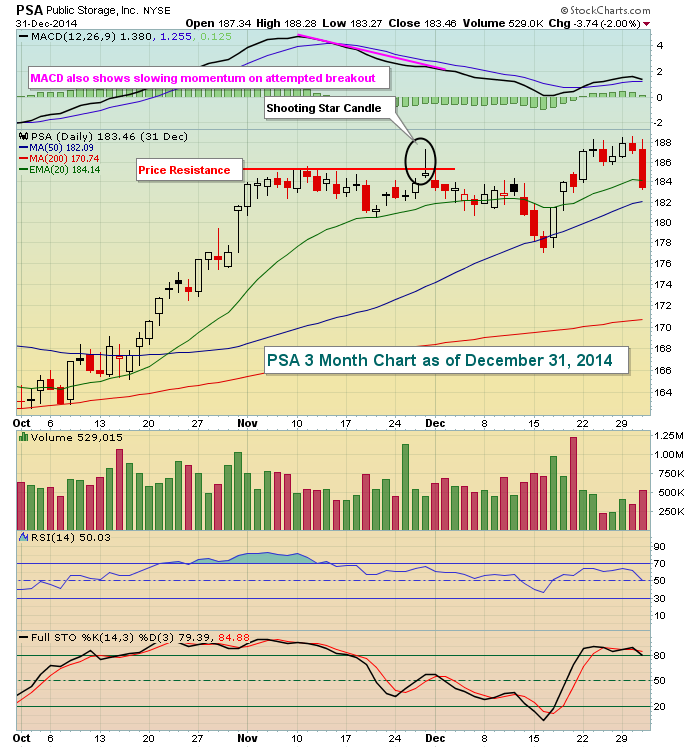
Let's move on to another illustration. In late November 2014, Public Storage (PSA) was breaking out intraday only to see its gains vanish by the close that day. That left a long "tail" (intraday high) above price resistance with a close below, or a failed breakout. Worse yet, PSA had been trending higher over the previous five trading sessions and gapped up on the day of the reversal. A shooting star candle forms after a gap higher and failed intraday move higher. On the heels of an uptrend at resistance, a shooting star candle provides us a clear opportunity to take our profits and run. Check out PSA, Example 2:
While trading is always easier with hindsight, it is important as a trader that you always view the charts objectively each and every day. It's easy to fall into the "well maybe it won't happen this time" category, but remember we're traders. If resistance and our target are hit, we should reward ourselves by taking the money. Don't let those short-term profits evaporate. Of course, if you have a longer-term buy and hold mindset, this entire discussion is a moot point. I'm illustrating from a purely technical trading perspective.
I'm going to take a slightly different approach to this topic tomorrow. Up until now, I've focused entirely on individual stocks. Sometimes, a major index or sector is showing signs of a possible top and if you own stocks within the space, you could be taken lower by association. The index I'll look at tomorrow is the Russell 2000 ($RUT). Check out this chart and ponder why it may have been a great time to take profits on small caps on March 23rd/24th:
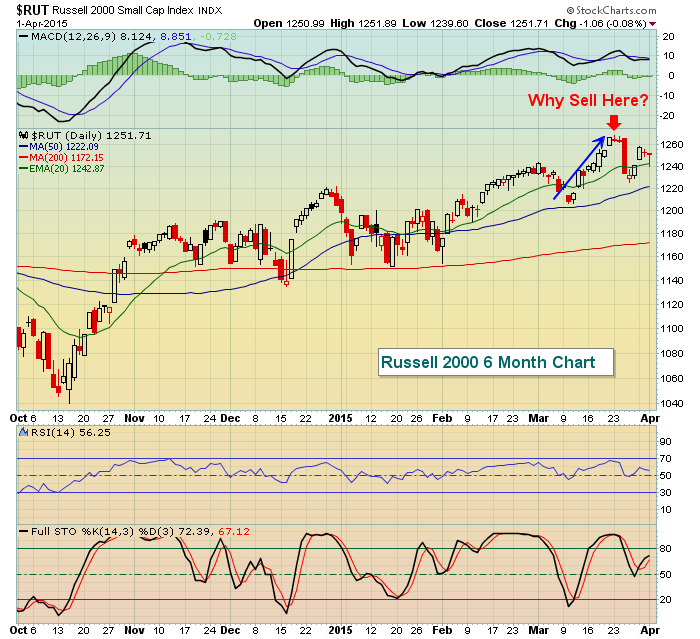
At this point, the Russell 2000 is in all-time high territory. There is no price resistance and the MACD is moving higher on the rally. Without the benefit of a reversing candle, why would we consider selling?
Happy trading!
Tom


