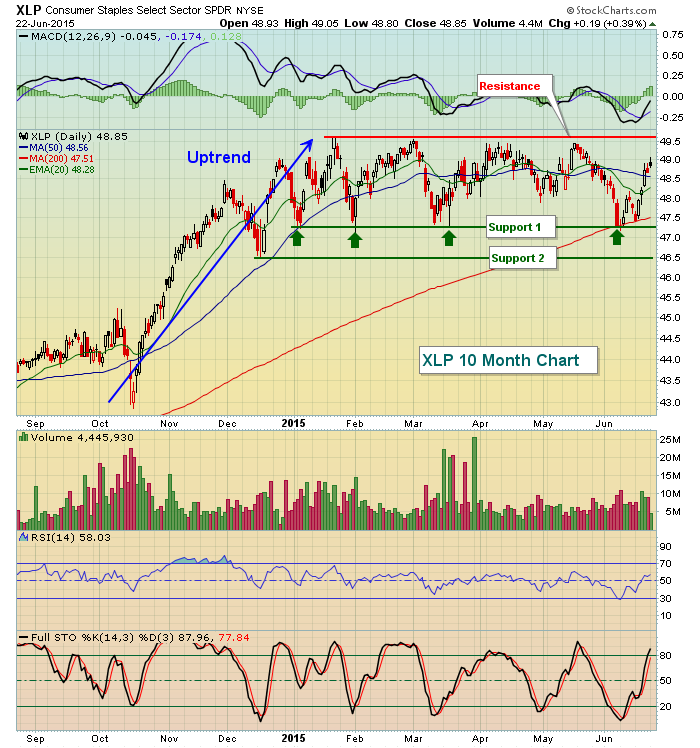
After testing 2075 price support for about the sixth time a week ago, the S&P 500 has rallied close to 2.5% since that low. While all nine sectors have participated in this rally, energy has been the laggard while consumer stocks, especially staples, have led this rally. The surge in the consumer staples ETF (XLP) came at an opportune time technically, as both recent price support and the rising 200 day SMA were being tested. Check out both the S&P 500 and the XLP charts below:
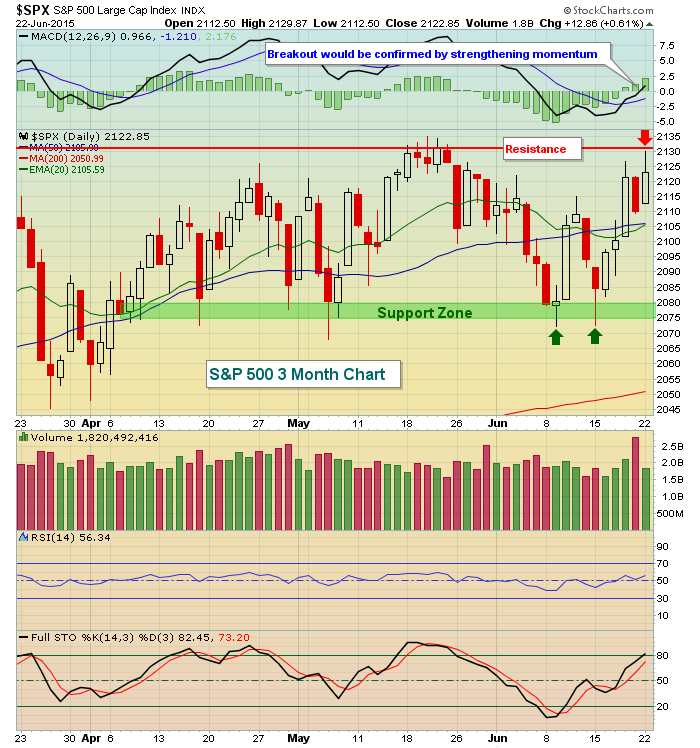
S&P 500:
Consumer Staples (XLP):
On the S&P 500 chart, the green arrows clearly mark successful tests of 2075 support. In fact, if 2075 support is ultimately broken, I'd look for additional selling to kick in. That's a clear level of short- to intermediate-term support in my view. But after the rally over the past week, price resistance is now in focus. 2130.82 is the all-time high close and that will be facing the bulls as Tuesday's action kicks in. Consider 2075-2131 the current trading range until it's broken in one direction or the other. Most signs still point bullishly in my view, but failure at key resistance could stall the market temporarily as 2nd quarter earnings approach.
On the latter XLP chart, there's been lots of consolidation throughout 2015 with the key trading range being 46.50-49.60. The XLP does still have another 1% upside potential before the 49.60 area comes into play. Within the consumer staples space, however, performance has been interesting and indicative of the rotation that typically takes place during bull markets. As an example, consider that the Dow Jones U.S. Tires Index ($DJUSTR) has barely budged higher (0.26%) while just about every other industry group in the consumer staples sector is up 2.5% or more. At first glance, this might suggest that tires is an area to avoid. A deeper look, however, reveals that the DJUSTR is up 13.48% over the past three months, BY FAR the best performing industry group within consumer staples. Check out the weekly chart on DJUSTR:
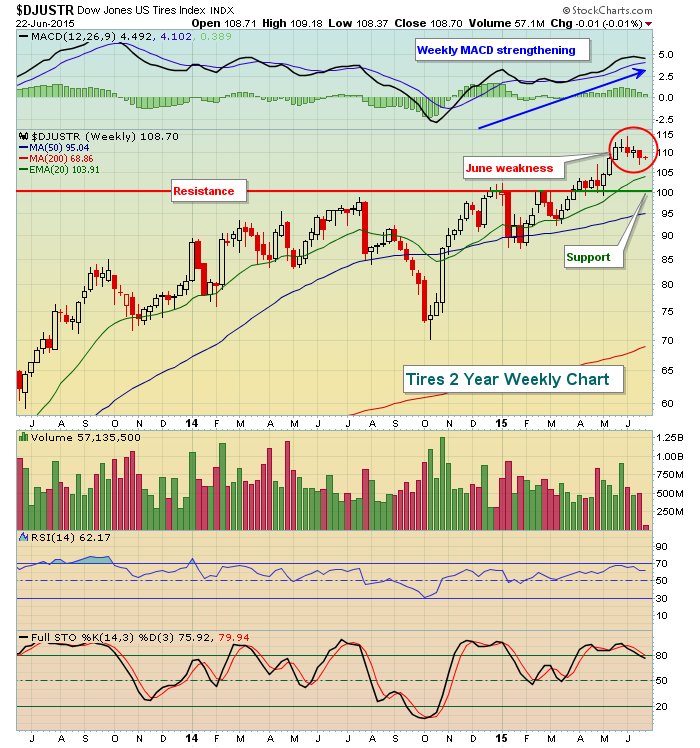
The red circle above highlights the weakness that we've seen in tires the past few weeks. But this masks the underlying strength in the long-term technicals here. The weekly MACD is very strong and the rising 20 week EMA should provide excellent support on any further selling. Over the last few weeks, there's been some profit taking in the tires space while other areas of consumer staples have benefited.
One area that's clearly benefited technically is the drug retail industry ($DJUSRD) as this group has just broken out of a bullish inverse head & shoulders pattern on increasing volume. The measurement here would suggest another 5-6% upside and I'm providing two drug retail stocks below that should perform well if this pattern plays out:
MCK:
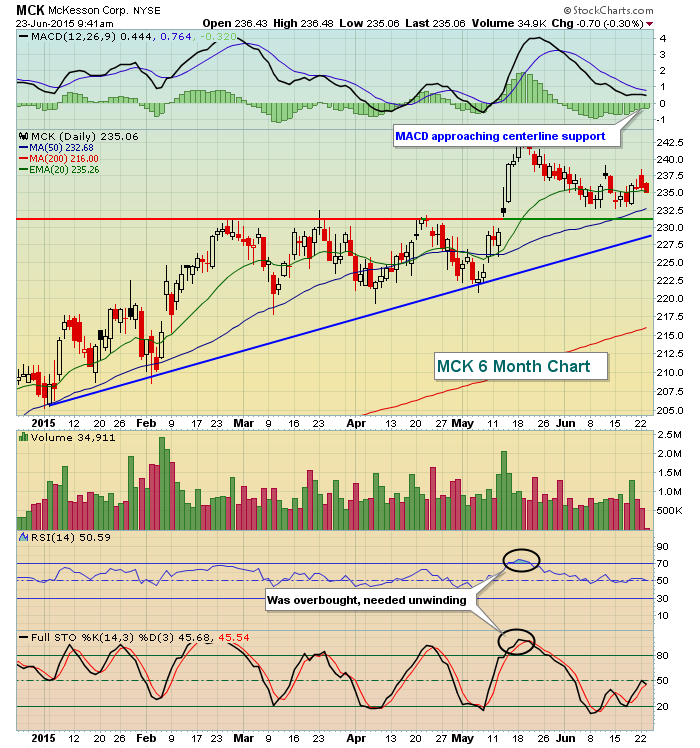
MCK was very overbought at its recent peak, but has settled down on the recent pullback and isn't far from nice support in the 229-232 area, where price, gap and trendline support all converge.
CVS:
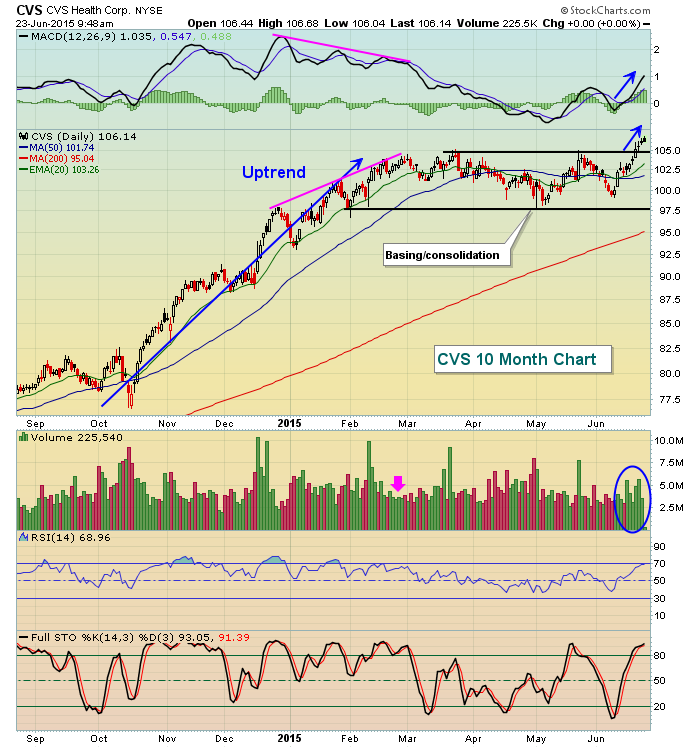
CVS showed a powerful uptrend into early 2015, but momentum stalled as evidenced first by the lower MACD with each new price high in January and February. The pink arrow shows volume declining significantly on the last gasp of the uptrend. Since that time, CVS has consolidated and underperformed the broader market - until this past week. Volume has once again picked up as CVS broke above those February highs and check out the MACD on this move - pointing straight up. Outside of a potential short-term pullback to relieve slightly overbought conditions and to test price support close to 105 or possibly the rising 20 day EMA, currently just above 103, I'd expect to see higher prices from CVS.
During my webinar on Wednesday at noon EST, I'll take a look at several sectors/industry groups within the market where opportunities exist. Join me if you can - it's FREE! Simply CLICK HERE to register and be sure to "Subscribe" to my blog to the upper right side of my article. Click on "Email updates", type in your email address, hit the "Subscribe" button and you're set. You'll begin to receive all of my blog articles in your email the moment they're published!
Happy trading!
Tom


