There have been more and more areas of the U.S. stock market that are showing signs of slowing momentum to the upside and it's begun taking a toll on several of those areas. Over the past six months, healthcare (XLV) and consumer discretionary (XLY) have outperformed. But every industry group within healthcare has a negative divergence on its weekly chart. That hasn't seemed to affect that sector yet as most of the industry groups continue to push higher. It should be noted, however, that healthcare and consumer discretionary have been the two worst performing sectors over the past week. Before I look at sectors and industry groups that could be under siege, let's first look at the S&P 500 chart for levels of key support to watch. First, the weekly chart of the SPX:
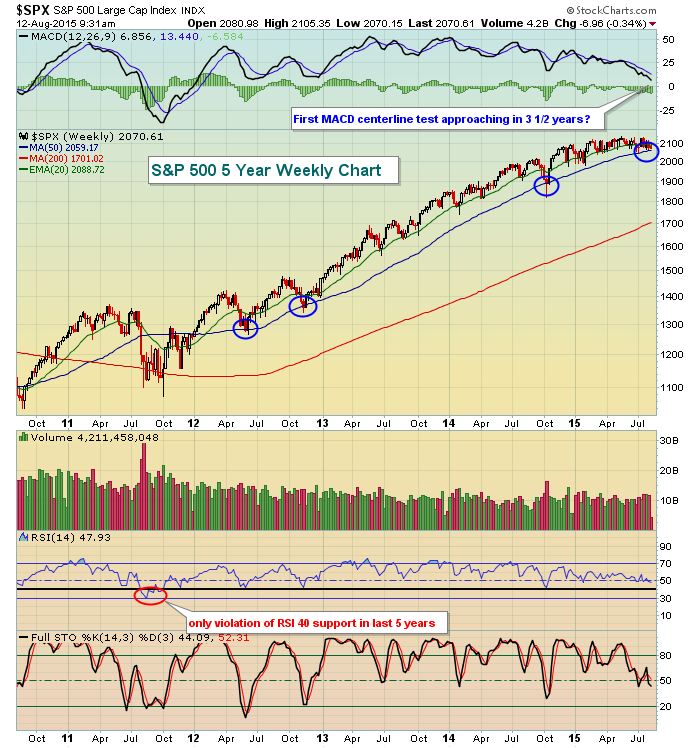
There is plenty to talk about on this chart. First, the price action has been straight up throughout much of this bull market (since March 2009). After the approximate 20% correction during the summer of 2011, the S&P 500 has seen little extended weakness. Yes, the October 2014 bottom was a bit scary but on this chart, even that selling looks like a blip on the radar screen and nothing more than a 50 week SMA test with RSI 40 support tested. Weekly RSI has once again dipped into the 40s - and that hasn't happened often the past few years. From a price perspective the 4th quarter 2014 rally has been extended in 2015, but it certainly appears labored. Selling has been limited to 50 week SMA tests over the past four years and each has held. Currently, that suggests we watch to see whether the rising 50 week SMA near 2059 holds. If it doesn't, the 4th quarter 2014 and 1st quarter 2015 lows from 1975-2000 come into play. Finally, the October 2014 low is critical in my view because it marks key support in the higher high, higher low uptrend. Failure to hold there would begin to argue for shorting bounces and 20 week EMA tests from underneath.
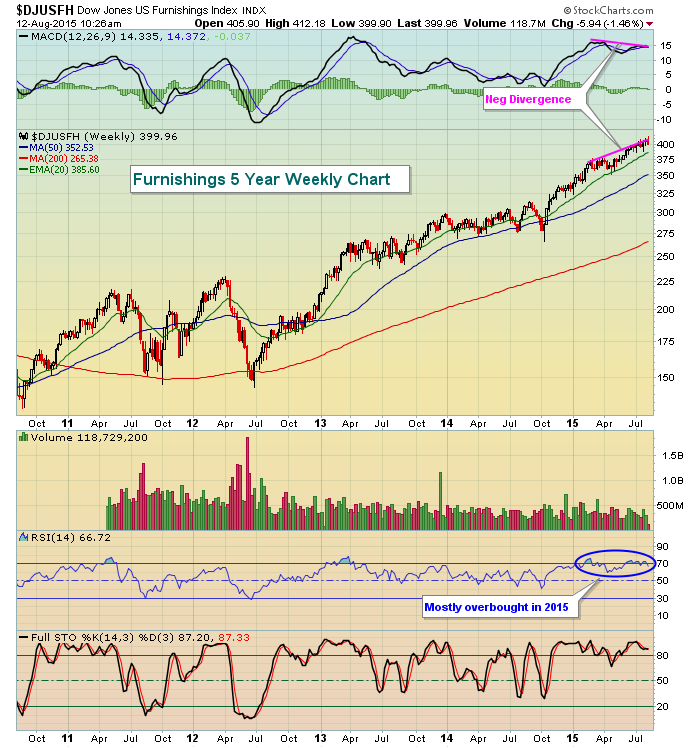
Back to key leadership. A potential bear market really begins to gain a stranglehold on traders when market leaders no longer hang onto support. Some of those leaders have shown slowing momentum, but few have actually broken down. I've written previously about the healthcare sector and all of the industry groups within that sector showing negative divergences on weekly charts. All of those negative divergences remain despite fairly decent price behavior since I published my article. Medical supplies ($DJUSMS), in particular, have posted very nice gains over the past couple months. The caution flag is still up on the sector though. I want to turn my attention to a few of the consumer discretionary industry groups to watch. First up is Furnishings ($DJUSFH), which has posted solid gains of nearly 14% over the past six months. Check out the weekly chart here:
Overbought and negative divergences generally lead to either sideways consolidation or flat out selling. If leaders begin to sell more intensely, there have to be other areas that are technically sound to attract dollars. As fewer and fewer companies participate in the rally, that becomes problematic and can trigger more short-term selling.
Here's another group within the consumer discretionary space that could use some unwinding:
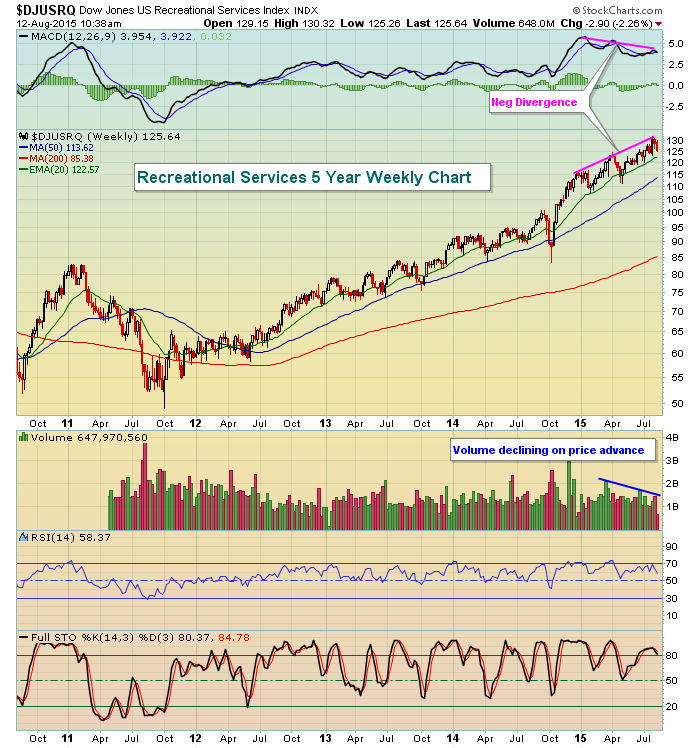
Negative divergences simply tell us that short-term moving averages are no longer "diverging" away from longer-term moving averages. Instead, they're "converging", which is unusual for an uptrending index or stock. It's an indication of slowing price momentum. Remember, the MACD does not take into account volume. But if you notice, volume has been declining on both of the above consumer discretionary charts as prices have continued rising, another sign of slowing momentum.
During bull markets, as one area weakens, rotation takes over and another area gains strength and absorbs the dollars flowing from weakening sectors and industry groups. The key area of rotational support in this bull market right now, in my opinion, are the financials where we still see technical strength. Many of the industry groups in this space are testing key technical support levels and need to hold together the market. Before I look at one of those key industry groups, it's important to realize that rising 10 year treasury yields ($TNX) have enabled many of the financial groups to lead and yield support is being tested. Failure to hold yield support would be a negative sign for the U.S. stock market, so let's take a look at the uptrend:
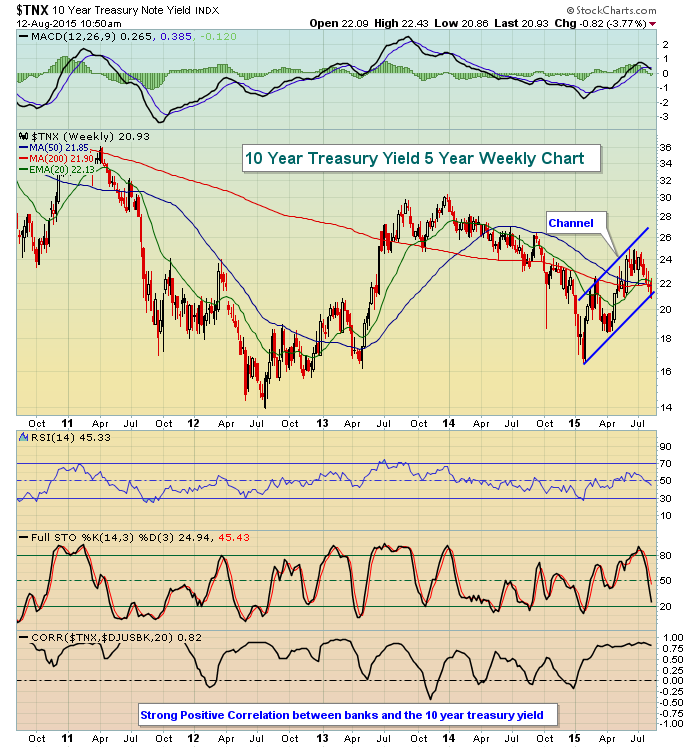
At the bottom of the above chart, you can see clearly that the 10 year treasury yield and the Dow Jones US Bank Index tend to move in the same direction. Currently, the 10 year treasury yield is hovering around key support at 2.10% and at the bottom uptrend line in its current channel. Breaking down would put further pressure on bank stocks and from the chart below, you'll see that banks are at an important technical level, testing their rising 20 week EMA - generally very solid support when the MACD is strong. Take a look:
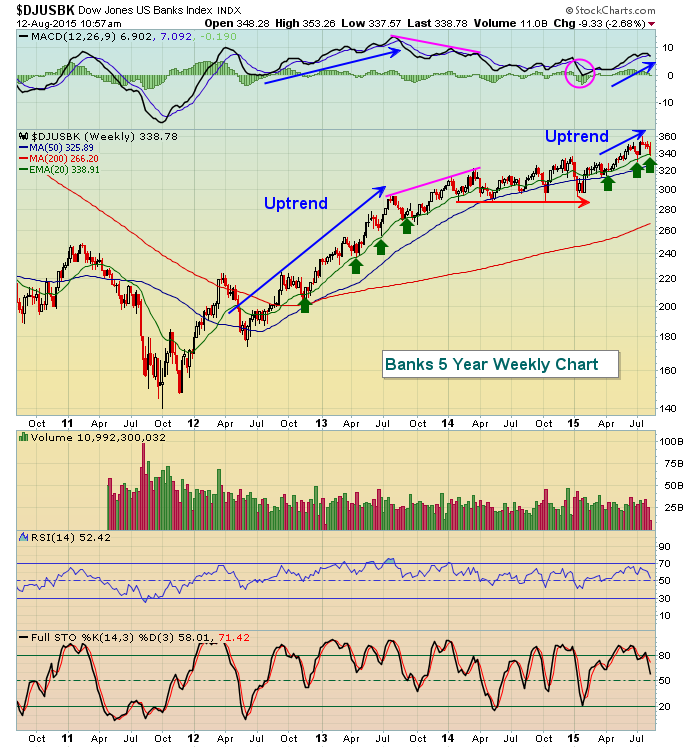
In this chart, you can see that the rising 20 week EMA offers up nice support during uptrends. Given that the 10 year treasury yield is at key support near 2.10%, now is the time for the yield to turn higher. Given the positive correlation between the TNX and banks, I'd expect banks to do the same. If they cannot and the yield and banks both break down together, it's going to be much more difficult for the bulls to find enough band-aids to keep the bull market humming along during the bearish historical months of August and September.
Keep your guard up.
Happy trading!
Tom


