Market Recap for Wednesday, October 7, 2015
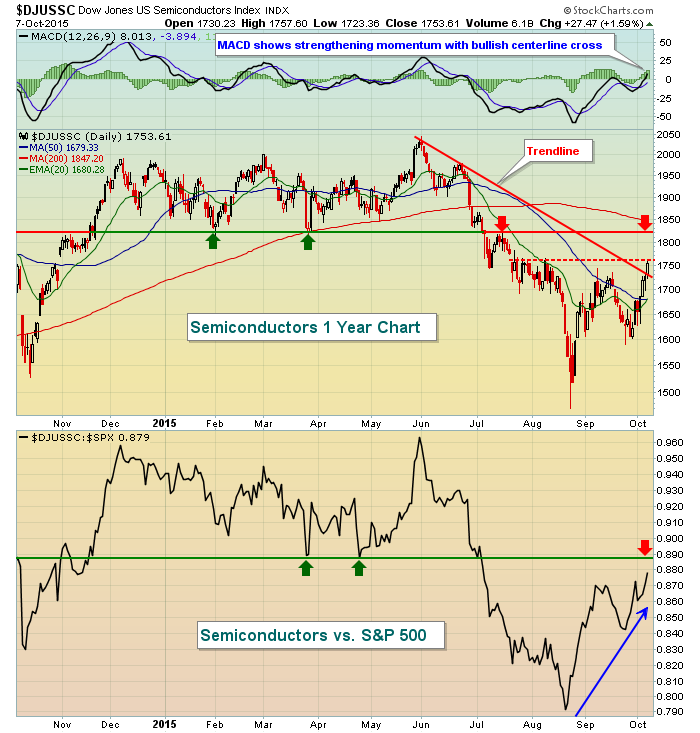
European markets ended in positive territory again on Wednesday and that's certainly providing a lift for the U.S. market. Healthcare (XLV) picked itself off the floor and led the action, gaining 1.60%. The beaten down biotech space bounced 2.48%, although it failed to clear any important area of resistance as it currently trades beneath its falling 20 day EMA. Of the top 5 sectors on Wednesday, the only aggressive participant was industrials. Technology, financials and consumer discretionary all lagged and this has been a common theme of late - lack of leadership from riskier areas of the market. Semiconductors are beginning to show nice relative strength as you can see from the chart below:
There are mixed signals everywhere on this chart. I love to see relative strength in semiconductors and their performance relative to the S&P 500 has been trending higher off the August low. But this could be nothing more than a relative "bounce" after the awful performance from June to mid-August. Another positive is the break of the downtrend line when connecting the highs in June. But the negative there is that a downtrend line is only as strong as the number of price points it connects. A trendline connecting two points is often broken only to fail. There are two key areas of price resistance worth watching here. First is the red dotted line that highlights the reaction high after the huge gap lower in mid-July. Semiconductors have tried on numerous occasions to clear that level and failed. We tested it again on Wednesday without any luck thus far. If the bulls can negotiate this level, we still have a serious resistance area near 1825.
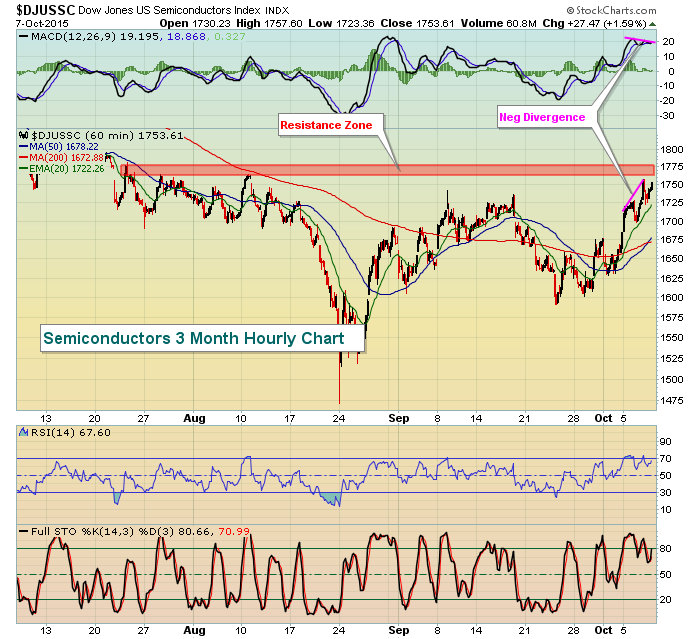
There's another problem with semiconductors and it's the same issue that plagues our major indices - 60 minute negative divergences. Take a look at the hourly chart:
Utilities lagged on Wednesday and was the only sector to finish in negative territory, no doubt in response to the 10 year treasury yield ($TNX) climbing.
Pre-Market Action
U.S. futures are lower this morning, but off their overnight lows with action overseas mixed. China's Shanghai Composite ($SSEC) rose 3.0% overnight but has continued to trade in a fairly narrow 3000-3250 range over the past five weeks. This follows the stunning volatility from March through late August. The Nikkei ($NIKK) and Hang Seng ($HSI) both finished lower. In Europe, action opened lower but we've since seen a reversal with the German DAX ($DAX) now in positive territory, once again challenging its 10,000 level.
There'll be little news out today, but 2pm EST could be interesting as the FOMC minutes will be released from the September meeting. If you recall, it was the FOMC announcement that created a ton of skepticism among traders. It's ironic that our major indices reside almost exactly where they were when the announcement was made on September 17th. Will the reaction be different this time or simply a case of deja vu?
Current Outlook
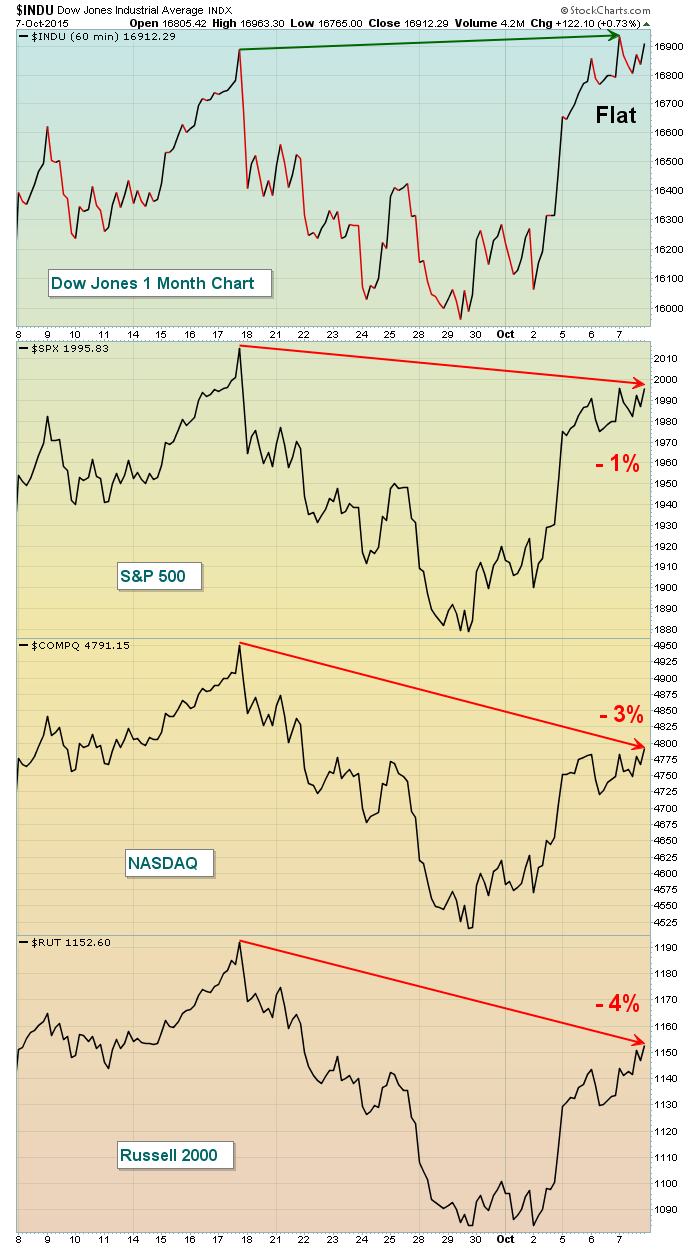
The bulls continue to knock on the door of resistance. The good news is that the bulls are a very resilient bunch, but the bad news is that time could be running out on a break of this downtrend. Money is shifting and not in a good way. First, it's clear that traders have a preference of late for the Dow Jones and S&P 500 over the more aggressive NASDAQ and Russell 2000. The former two have closed at highs that eclipsed highs from late-August and mid-September. The latter two continue to try. The following chart should help you visualize what's transpired since that September 17th FOMC announcement and the peak that resulted:
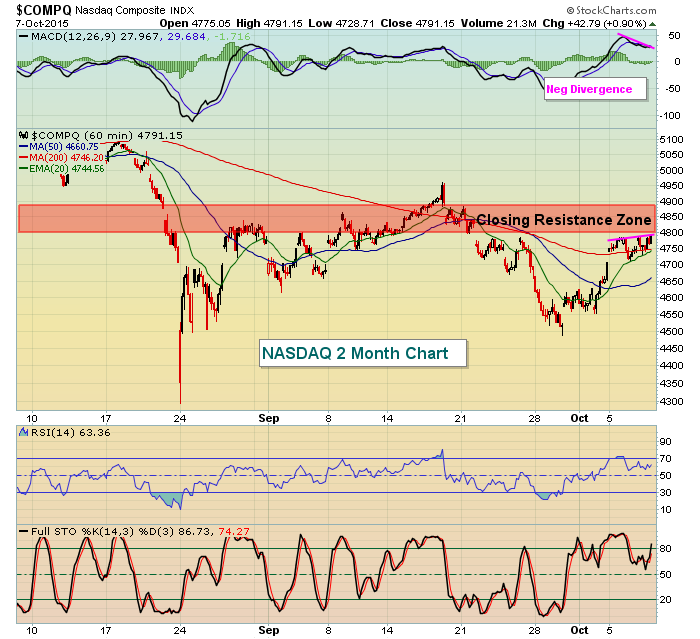
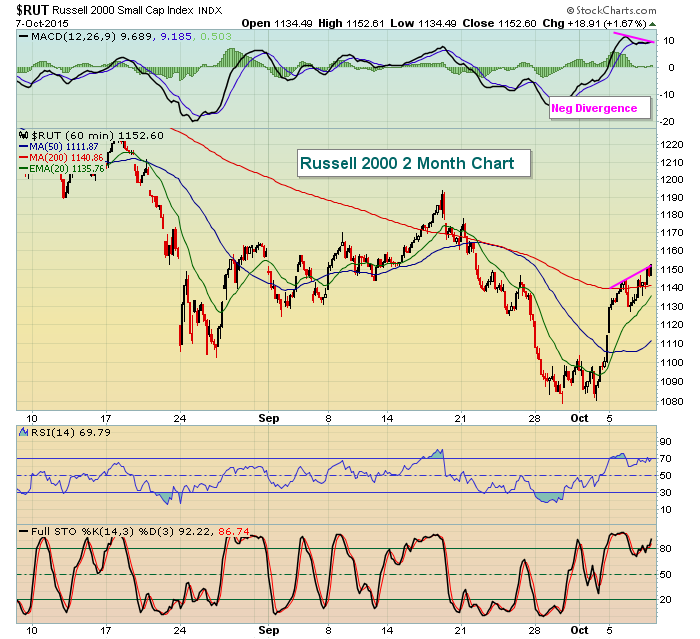
This is a very simple chart that tells me one thing. Traders do NOT want risk after that FOMC announcement and money has been rotating AWAY from it ever since. We have seen money rotate back towards both the NASDAQ and Russell 2000 in October so that helps, but we've still got a long way to go. Furthermore, 60 minute negative divergences are everywhere and that indicates slowing upside momentum just we once again test key resistance levels. None of this guarantees the market will head lower, but it does suggest risk is elevated. Take a look at the negative divergences on both the NASDAQ and Russell 2000 below:
NASDAQ:
Russell 2000:
Keep one thing in mind. Negative divergences can be eliminated if price action continues higher. In fact, many do get eliminated. So please don't view these as guarantees of future price action. They are nothing more than warnings. If you're a shorter-term trader, they should be alerting you to the possibility of an upcoming reversal. The fact that they are occurring as daily price action hits or nears significant price resistance carries more meaning - in my opinion.
Sector/Industry Watch
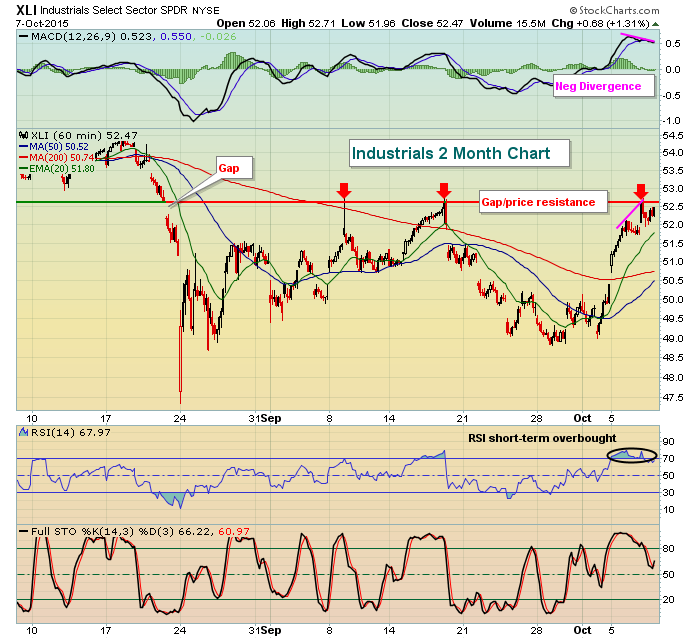
The theme for today is apparent slowing momentum in the form of 60 minute negative divergences so let's focus on one sector that's showing such slowing momentum at a critical price juncture as well. Industrials (XLI). The XLI is at price and gap resistance and also printing a negative divergence on its MACD. Check this one out:
52.50-52.75 has proven to be difficult resistance in the past and now we see a negative divergence on the hourly chart as we're testing it once again. The odds are high that we'll see a short-term failure, although it's no certainty.
Historical Tendencies
In general, October tends to be strong from the 1st to the 6th, then weakens from the 7th to the 10th. Tomorrow, October 9th has been one of the worst days in October on the S&P 500 since 1950. It has produced an annualized return of -86.07% over that span. Once we negotiate the 10th, the historical outlook brightens through the 15th, then volatility generally picks up from the 16th to the 21st as we approach the worst historical week of the year.
Key Earnings Reports
AA: .15 (est) - reports after the bell today
Key Economic Reports
Initial jobless claims released at 8:30am EST: 263,000 (actual) vs. 271,000 (estimate)
Happy trading!
Tom

