Market Recap for Monday, October 5, 2015
This tennis match continues to unfold with the bulls returning serve the past few trading sessions. It appeared to be game, set and match on Friday morning when the disappointing jobs numbers were released, but there's been nothing but buying since. The NASDAQ, since it hit a low of 4552 in early trading on Friday, has rallied back more than 4% and is close to the 4800 level. Strength was seen on Monday across all nine sectors, although healthcare lagged badly and finished just 0.26% higher. All other sectors were higher by at least 1% with energy again paving the way as it gained 3.02%. Energy (XLE) is up nearly 10% over the past week, closing above its 50 day SMA for the first time since May. Its 20 day EMA is also rising for the first time since late April and the MACD is rapidly approaching centerline resistance. The key for the XLE will be whether it can now hold that rising 20 day EMA on periods of selling. If so, then this group likely has seen its bottom. Check out the chart:
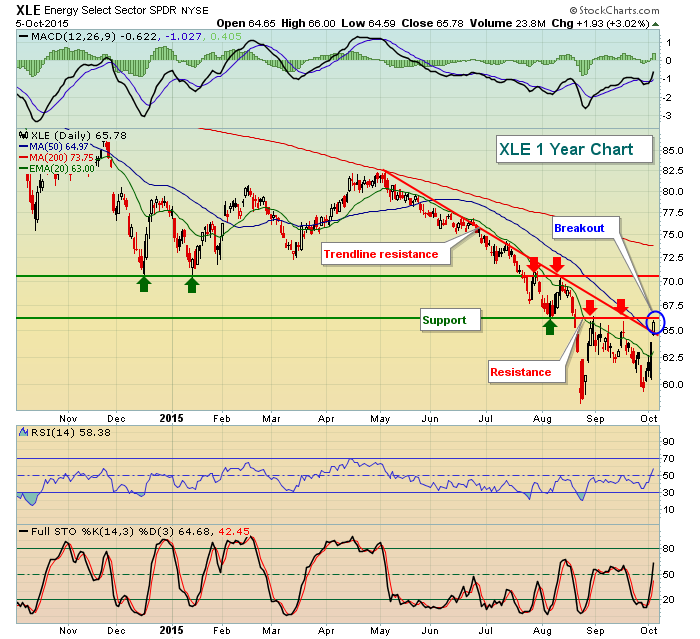
Energy bulls have passed a couple of technical tests the past two days, but stiffer tests lie directly ahead. Initial price resistance is at 66.29. If the XLE can negotiate that level on a closing basis, the odds are favorable to reach the next resistance area from 70.75-71.00. That would represent another 6% advance or so.
Trading in Europe was very strong yesterday and that helped to sway buyers into the U.S. market as well. The German DAX gained 2.74% and closed at 9815, just 11 points beneath its declining 20 day EMA. A technical test awaits the German market today.
Pre-Market Trading
Overnight trading in Asia and Europe is mixed. The Tokyo Nikkei ($NIKK) was up 1% with the Hong Kong Hang Seng ($HSI) down fractionally. At last check, the German DAX ($DAX) was up 10 points, literally sitting on its 20 day EMA - a significant technical test of resistance in a downtrending market. Because the correlation between German and U.S. markets is so tight, it's definitely worthwhile to keep an eye on this test to see if the bulls can succeed.
U.S. futures are down as we approach the open, but are well off overnight lows. The short-term market bias remains to the upside but closing the S&P 500 above 2000 will not likely be an easy task. We failed just below 2000 after the FOMC announcement on September 17th, creating price resistance. And now the falling 50 day SMA is at 2000. It doesn't mean we can't close above, but there would be technical significance in doing so.
Current Outlook
Clearly, the market environment has improved. But we do remain in a short-term downtrend for now. Technically, I'd refer to the action since mid-August to be that of a bear flag. Ordinarily, these patterns break to the downside if we're already in a downtrend. But this bear flag IS the downtrend so I'm not sure it breaks lower. On the NASDAQ, the major resistance zone is very clear so let's take a look:
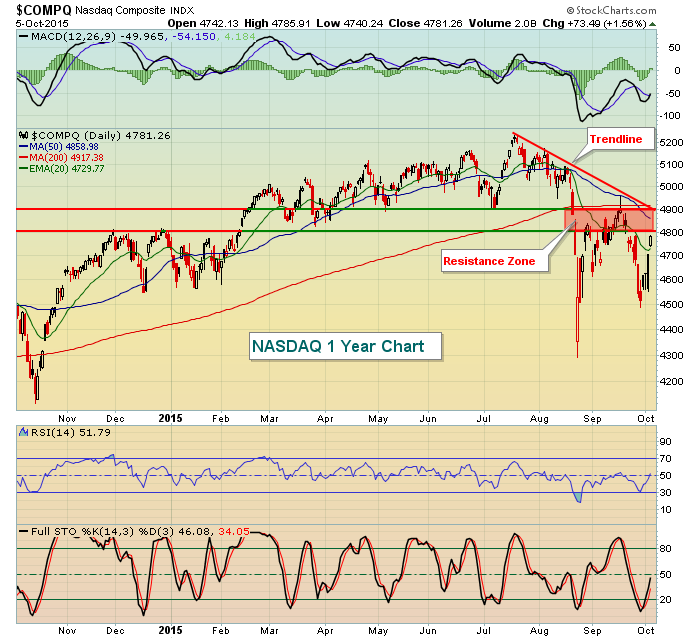
The red shaded resistance zone is approaching and this is where I'd expect a battle to take place. Knowing that we have one more very bearish historical period later this month, it's possible this entire August-October debacle plays out into a bullish symmetrical triangle that ultimately breaks out later this year. The following is a longer-term weekly chart that shows the possible bullish formation taking place on the NASDAQ:
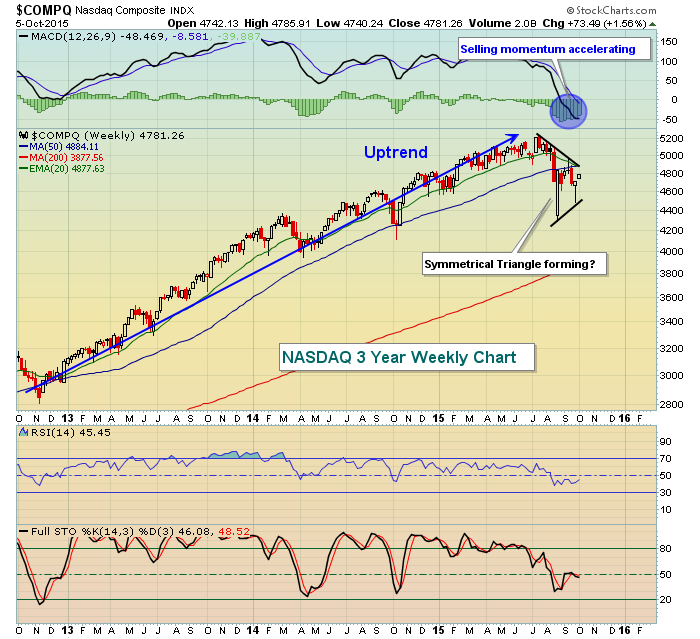
That's the bullish argument and until the October 2014 lows are taken out, I'll side with the bulls. But currently that means we have a very wide trading range to contend with. Therefore, a lot of whipsaw action is possible. Closing price support resides at 4500 while the key resistance level reflected above is 4900. While 400 points seems like a lot of points, the NASDAQ went from an all-time high in early July to a 17% decline by late August so anything goes right now. In addition to all the points of resistance in the resistance zone reflected on the daily chart above, the bulls will also need to contend with the declining 20 week EMA on the weekly chart. Currently, that level is at 4877, yet another reason to sell in that 4800-4900 area.
Sector/Industry Watch
Take a guess which industry group is the best performer over the past six months. If you guessed internet ($DJUSNS), you'd be wrong. If you guessed toys ($DJUSTY) or brewers ($DJUSDB), you'd be wrong. Footwear ($DJUSFT) has been the best performing group, running well ahead of other areas of the market. They're up 20% in the past six months while the S&P 500 is down more than 4% over the same time period. Visually, the chart doesn't lie - check it out:
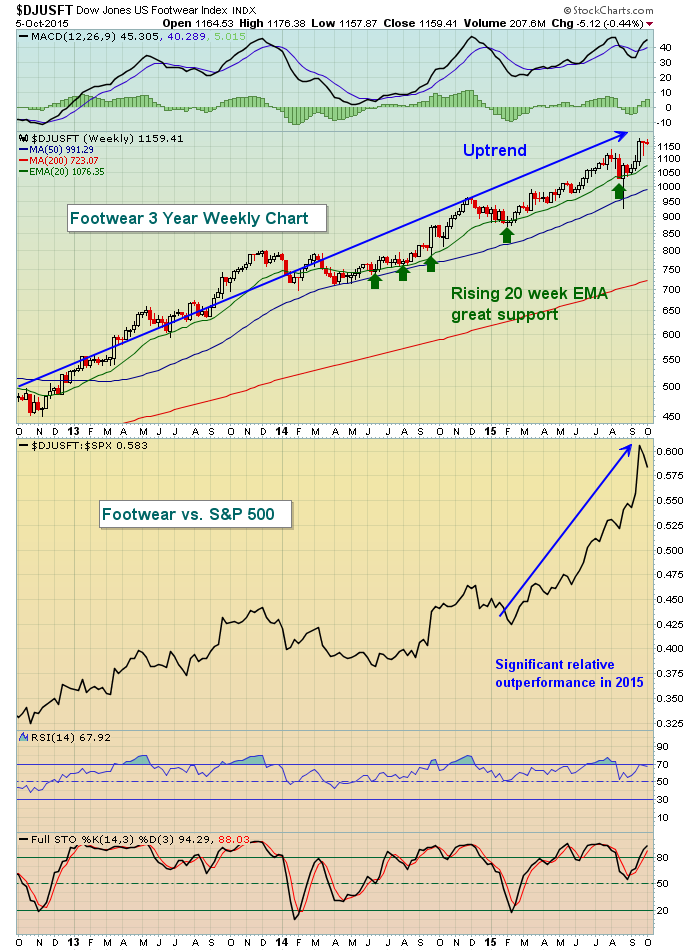
Last month, I mentioned in this blog and during my webinars that Nike (NKE) and the footwear index both perform exceptionally well during the month of September and September 2015 was no exception. October through December also represents seasonal strength, but not nearly what we see during September. We are overbought on this index and there's a slight negative divergence on the MACD that will either need to be eliminated or dealt with in some fashion. Footwear is a leader but could use some short-term selling to improve a reward to risk entry.
Historical Tendencies
I thought since we spend so much time talking about historical trends here in the U.S. that it might make sense to take a look at seasonal trends overseas. Below is the 20 year seasonality chart for the German DAX:
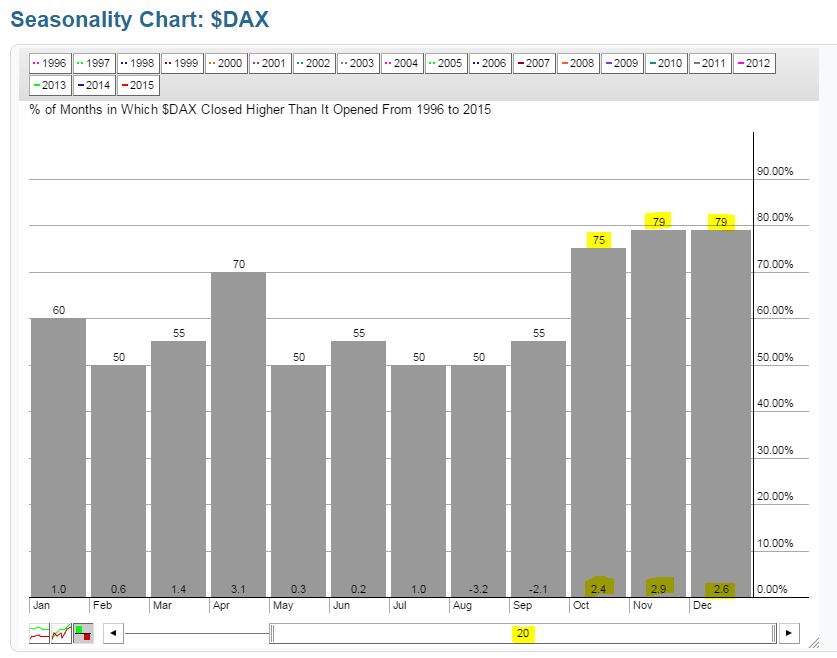
Similar to the S&P 500, the German DAX typically sees weakness in August and September with strong seasonal strength returning in Q4. So if the DAX can clear its first technical hurdle at its 20 day EMA, historical tailwinds could begin to kick in as we wind down 2015.
Key Earnings Reports
PEP: $1.35 (actual) vs. $1.26 (estimate)
YUM: $1.07 (estimate ) - reports after the bell
Key Economic Reports
None
Happy trading!
Tom


