Market Recap for Monday, November 9, 2015
Monday represented the worst one day performance for U.S. stocks since the late September low printed. 8 of 9 sectors were lower, led by consumer discretionary (XLY) and financials (XLF). The only sector spared was the defensive utilities (XLU) group, which simply bounced after a rather ugly downtrend the past couple weeks. Railroads ($DJUSRR) managed strength, but most areas saw profit taking. Every industry group within technology, consumer staples, healthcare and financials was lower. Among the four aggressive sectors - technology, industrials, financials and consumer discretionary - only two industry groups advanced - railroads and business training & employment agencies ($DJUSBE). That's what I call a concerted selling effort.
So the question becomes "how will traders respond to our first significant selling episode in 5-6 weeks?" Futures this morning (discussed below) suggest they're not responding too well as we're likely to see the selling continue at the open.
Special Note
I will be doing two webinars on Wednesday. I'll be hosting Trading Places Live on Wednesday from noon to 1pm as I always do. CLICK HERE to register for this FREE webinar. Then at 7:30pm EST, I'll be joining John Hopkins, President of EarningsBeats.com, for another webinar to discuss trading strategies where we'll discuss many potential individual stock trades and how to trade gaps. You can sign up for this FREE webinar HERE. This webinar has limited seating so please register using the link provided and arrive early. John is also planning to join me during my Trading Places LIVE webinar for a segment of that webinar.
Pre-Market Action
European indices showed early strength this morning, but have since moved lower. U.S. futures seem to be following those moves closely as traders have little else to trade off of currently. Our major indices were overbought after the recent rally to test key price resistance levels so short-term sellers have taken over.
There aren't many big names reporting earnings today, although two homebuilders, DR Horton (DHI) and Beazer Homes (BZH), both reported earnings that topped Wall Street estimates this morning. DHI also beat revenue forecasts while BZH came up short on their top line. Home construction ($DJUSHB) is an area worth watching today as this group is at key support and has earnings news to trade with DHI and BZH out with their results. Here's the current chart:
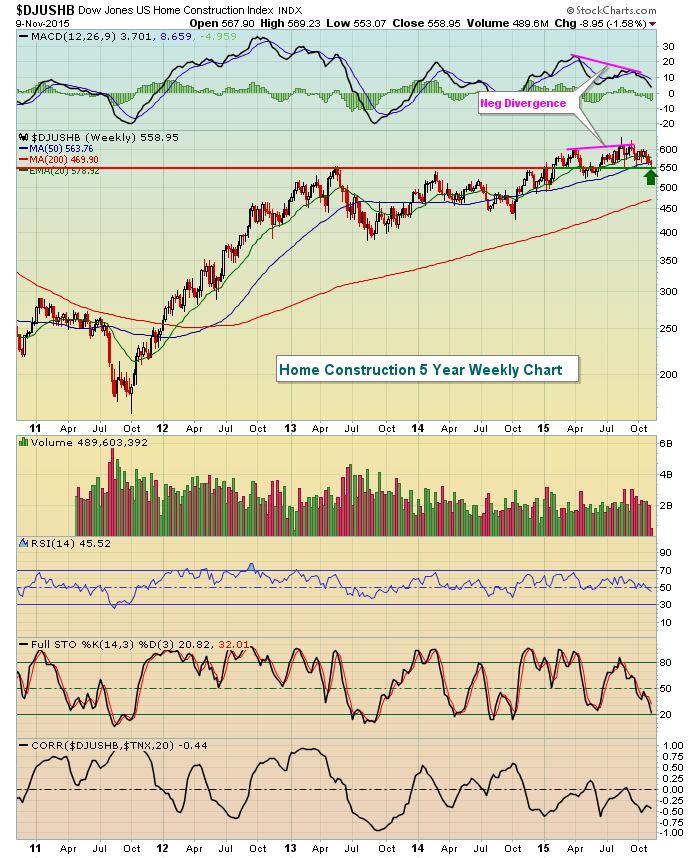
The 550 level has been significant in the past and we're at 559 to start the day. The bottom of the chart reflects the correlation between home construction and the 10 year treasury yield ($TNX). Common sense might suggest that higher treasury yields would lead to lower home construction prices, or a negative correlation. From the chart, though, you can see that's not really the case. In fact, there's seemed to be no consistent correlation between the two over the past 5 years. So I wouldn't necessarily avoid the group if the Fed begins to raise rates in December.
Current Outlook
Technical analysis is not a perfect science. Those who don't follow or believe in the power of technical analysis generally point to the failures as anecdotal evidence to support their case. For me, technical analysis is a necessary component of risk management - its purpose is not to provide guarantees. Those using technical analysis change their opinions quite often because it's based on price action and prices change constantly. Trading strategies that work one day or one week may not work the next. You have to be prepared to quickly admit mistakes and alter your line of thinking.
In addition, technical analysis can tell you one thing about the long-term picture and quite the opposite in the near-term. A recent example was the August short-term price breakdown despite a longer-term bull market in need of a correction. The August selling did nothing to change the series of longer-term higher highs and higher lows. The long-term uptrend remained intact. However, the short-term downtrend was obvious given the impulsive selling on heavy volume. Therefore, technical analysis can seem to contradict itself at times, making trading decisions much more difficult.
So.....getting back to today's headline.....has the rally ended or just begun? I believe it's just begun. The rally off the late September low was powerful and all of our key indices were approaching or testing price resistance. It was an obvious time for consolidation or a profit taking selloff. That's what we saw on Monday and could continue to see for a couple days to a couple weeks. The following is a chart of the SPY (ETF that tracks the S&P 500):
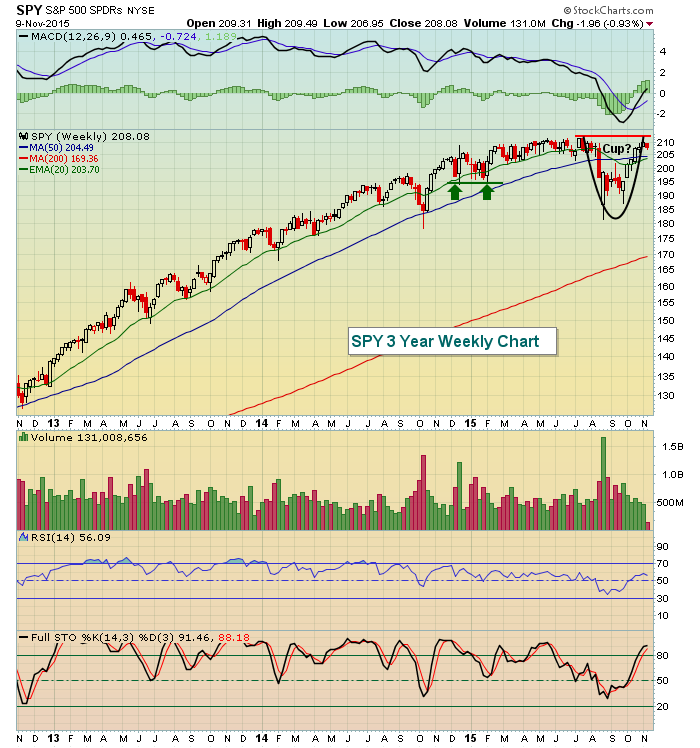
The rebound over the past couple months is similar to the rebound in late 2014. Note that after our rebound, the rising 20 week EMA held (first green arrow). On the next period of selling, the price low established during the first bout of selling held as price support (second green arrow). Then the rally resumed into 2015. Currently, I'd look first to the rising 20 DAY EMA. If that fails to hold, I'd expect the selling to grow deeper down to that rising 20 WEEK EMA. Here's a chart to reflect that 20 day EMA, the first line of defense for the bulls:
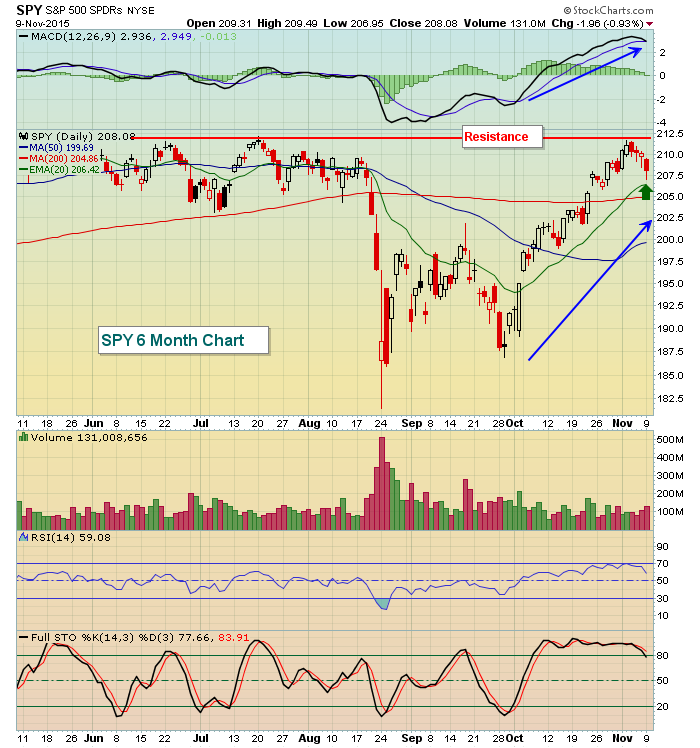
Short-term price momentum is very strong, as evidenced by the surging MACD at the most recent price high. Generally speaking, when I see strong momentum like that, I look to the rising 20 day EMA for initial support. We may test that level today after nearly seeing that test on Monday.
Sector/Industry Watch
Consumer discretionary (XLY) was the worst performing sector on Monday and travel & tourism ($DJUSTT) was the worst performing industry group within the XLY. Historically, the DJUSTT is one of the best performing industry groups during the month of November. It's off to a woeful start this November, however. On the weekly chart, it's quite possible that the worst is behind the group. The weekly MACD was on the rise and yesterday's selling took the index down to finish almost squarely on rising 20 week EMA. Check it out:
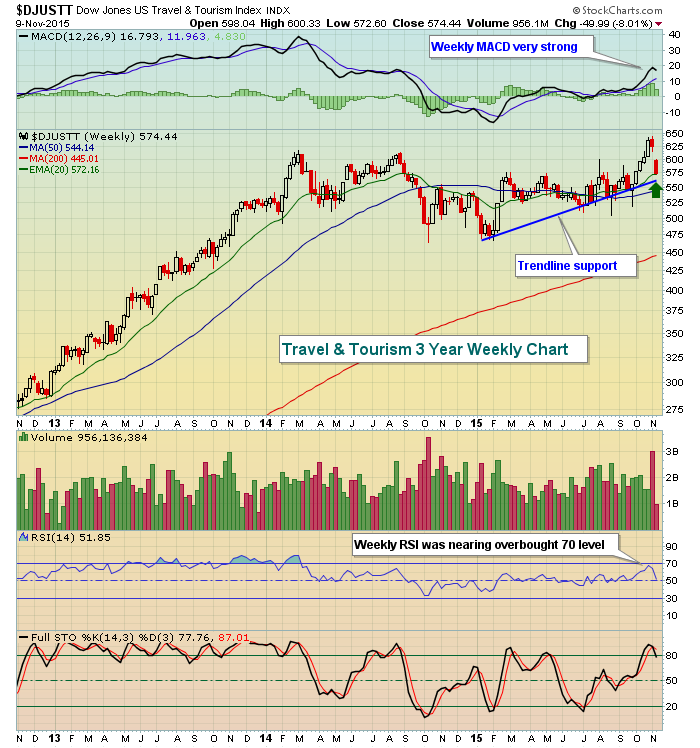
Keep in mind the current candle that's testing the rising 20 week EMA is not yet complete and won't be complete until Friday's close. So an intraweek move below the rising 20 week EMA to test trendline support shouldn't be ruled out. The key on this chart will be whether we CLOSE on Friday above that 20 week EMA, currently at 572. priceline.com (PCLN) was the culprit for the selling on Monday, but there have been others in the group that have reported very strong quarterly results, namely EXPE and CTRP.
Historical Tendencies
The selling on Monday fit the historical profile of profit taking from the 7th through the 10th and Mondays also have performed worse than any other calendar day of the week since 1950 on the S&P 500. Today is the 10th so additional selling to test key price or moving average support levels should not be ruled out. A reversing candle to hold key support after early weakness could set the stage for another rally by the bulls to end the week. We'll see.
Key Earnings Reports
(actual vs estimate):
BZH: .97 vs .92
DHI: .64 vs .62
ROK: 1.57 vs 1.78
ZBRA: 1.39 vs 1.09
Key Economic Reports
September wholesale trade to be released at 10:00am EST: +0.1% (estimate)
Happy trading!
Tom


