Market Recap for Thursday, November 5, 2015
Utilities and energy were the laggards on Thursday, which wasn't bad action considering the recent strength we've had. In other words, our aggressive sectors managed to perform well on a relative basis. Also, the small cap Russell 2000 index even managed to finish in positive territory - the only of our major indices to do that, continuing its recent relative surge. One concern of mine since the August bottom centered around the Russell 2000's performance. Why? Because this is an index of companies that does nearly all of its business right here in the U.S. When this index underperforms, it's a signal of domestic economic weakness, at least relative to global economies. From this next chart, you can see relative strength returning to the Russell 2000 vs. the S&P 500 during this latest rally, which is a good sign. Check it out:
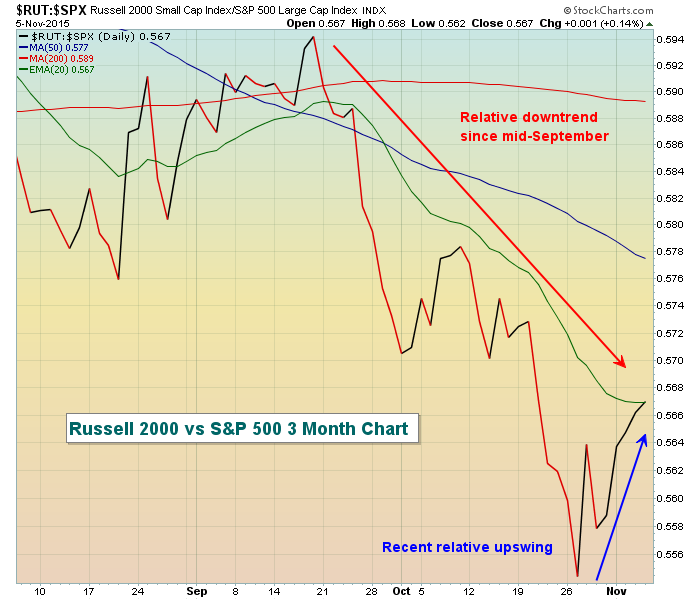
We finished the day Thursday right squarely on declining 20 day EMA resistance. So this first test of relative resistance will occur as we await the market's reaction to the latest monthly jobs numbers.
Biotechs ($DJUSBT) weighed on the healthcare sector as Celgene (CELG) disappointed Wall Street with its latest quarterly results and fell more than 5% on the session. Renewed concerns over Valeant Pharmaceuticals (VRX) sent its shares to new lows, down more than 14%. Despite these issues and Thursday's weakness, the DJUSBT finished the session roughly 3% above its now-rising 20 day EMA. Look to that level for short-term support on any further selling.
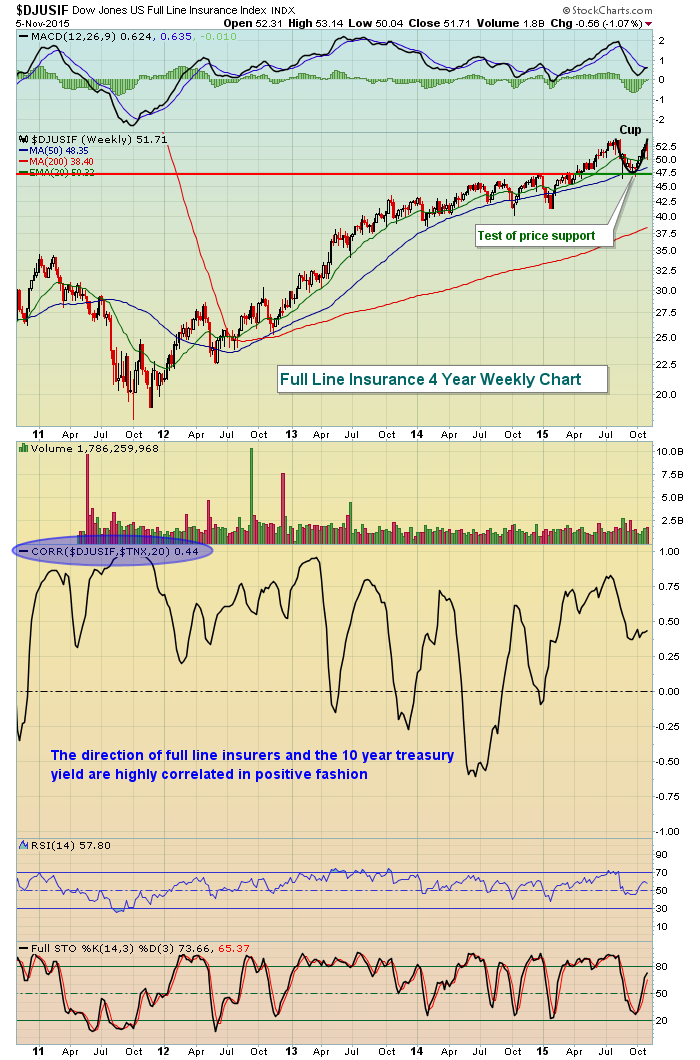
Financials and consumer discretionary were the leading sectors yesterday as banks ($DJUSBK) and other interest-sensitive groups rallied with the 10 year treasury yield ($TNX) up for the 6th time in the last 7 trading days. Full line insurers ($DJUSIF) are featured below in the Sector/Industry Watch section. As for consumer discretionary, clothing and accessories ($DJUSCF) surged back above both its 20 day EMA and 50 day SMA in the past three days and this group led all discretionary stocks on Thursday. The technical improvement can be seen below:
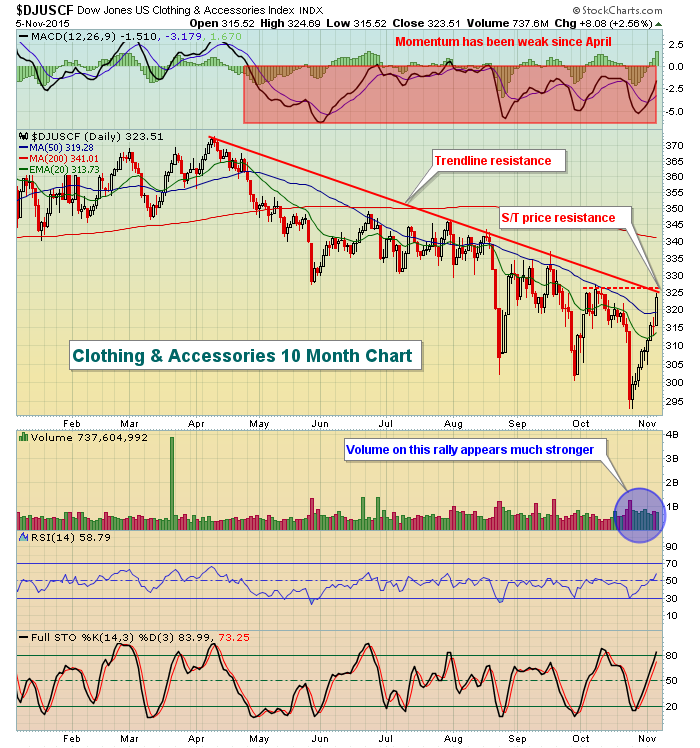
Not reflected above is that the rally on the DJUSCF has taken price up to challenge 20 WEEK EMA resistance on its weekly chart. So a break above the resistance area shown above would also be very bullish on the weekly chart.
Pre-Market Action
Action in Asia was mixed overnight, but China's extension of their breakout from Wednesday night was noteworthy. The China Shanghai Composite ($SSEC) is now uptrending and while there's been no significant correlation with the S&P 500 over the years, a rising SSEC is better than the alternative. In Europe, early trading has been cautious ahead of the U.S. jobs report with indices there mostly lower.
The 10 year treasury yield ($TNX) has been rising, perhaps in anticipation of a Fed rate hike. Fed Chief Yellen appears to be leaning towards a December rate hike, but has admitted it will depend on signs of continued economic strength. Today's jobs number is one of those "signs" and they were just reported at 271,000, WELL ABOVE the consensus estimate of 190,000. In fact, the HIGHEST estimate on Bloomberg was 240,000. The response in the bond market is exactly as I would expect with a huge selloff in treasuries, spurring yields over a key 2.30% resistance level. The TNX was at 2.32%, up more than 7 basis points, at last check.
U.S. futures have initially turned lower with the strong jobs numbers, but it will be much more interesting to see where we end the day.
Current Outlook
Today will be interesting. The jobs news out should be a positive for the stock market as it reflects an improving economic climate. But the stock market will need to continue to digest the likelihood of higher interest rates and what impact that might have. Interest rates remain near historic lows, so my view is that slightly higher rates won't impair economic growth, but I'll still defer to price action. The S&P 500, NASDAQ and Russell 2000 are all at or near key price resistance levels with short-term overbought conditions. Daily RSIs on both the S&P 500 and NASDAQ have been hanging near 70 for the past couple weeks so a brief pause just beneath price resistance wouldn't be a bad thing technically. Here's the current look at the S&P 500 and the key areas of price support and resistance to watch as post-jobs report trading begins today:
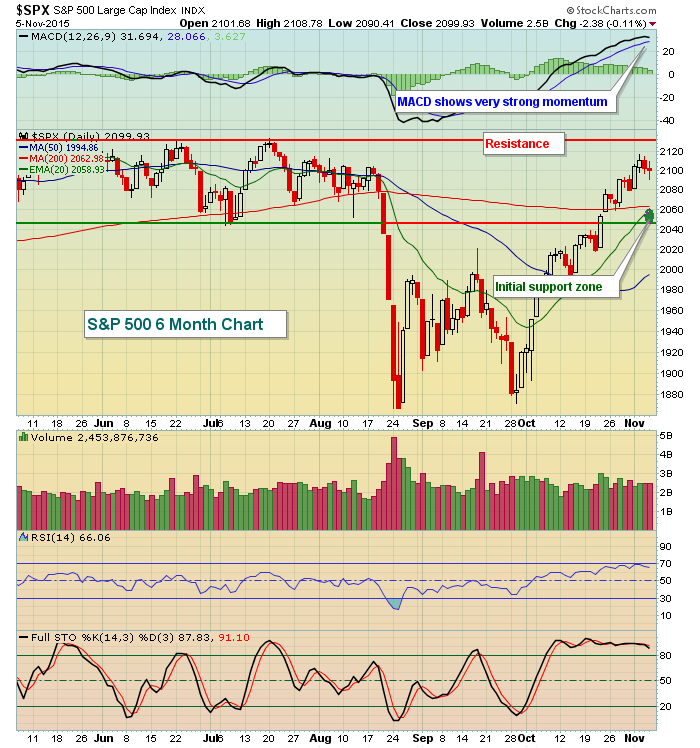
Price resistance at 2131 is clear. A breakout would be bullish for sure. To the downside, given the strong price momentum, the rising 20 day EMA at 2059 will provide support together with prior price support from earlier in the year close to 2045. So let's call support the 2045-2060 range as reflected by the green circle on the chart above.
Sector/Industry Watch
Full line insurance companies ($DJUSIF) have enjoyed a very solid advance since late January. That bottom coincided with the bottom in the 10 year treasury yield ($TNX). After a 30% climb, the DJUSIF pulled back to test price support and appears to be consolidating in a very bullish cup. A test of 54 price resistance would complete the cup with any subsequent short-term consolidation or weakness representing a possible handle. Take a look at the chart:
Historical Tendencies
November 6th (today) marks the end of the current historical bullish period for our major indices. The next two weeks will be VERY interesting, especially for the Russell 2000 ($RUT). The RUT has negative annualized returns for 12 of the next 14 calendar days (November 7th through November 20th). The good news? When this two week period ends, the Russell 2000 begins a bullish period unmatched by any of our major indices over any period. The end of November and the month of December (minus one brief stint early in December) is VERY VERY BULLISH historically for small cap stocks.
Key Earnings Reports
(actual vs estimate):
CI: 2.28 vs 2.17
HUM: 2.16 vs 2.14
Key Economic Reports
October nonfarm payrolls released at 8:30am EST: 271,000 (actual) vs 190,000 (estimate)
October unemployment rate released at 8:30am EST: 5.0% (actual) vs. 5.0% (estimate)
October average hourly earnings released at 8:30am EST: +0.4% (actual) vs +0.2% (estimate)
Happy trading!
Tom


