Market Recap for Wednesday, November 11, 2015
Wednesday wasn't a horrible day, but the back and forth action ended with a "back" as our major indices finished on or near their lows for the session. Mid-day it was much more promising than that as early losses had been erased and the ensuing rally enabled our major indices to print higher intraday highs for the first time since this bout of profit taking began. Check out the NASDAQ chart below:
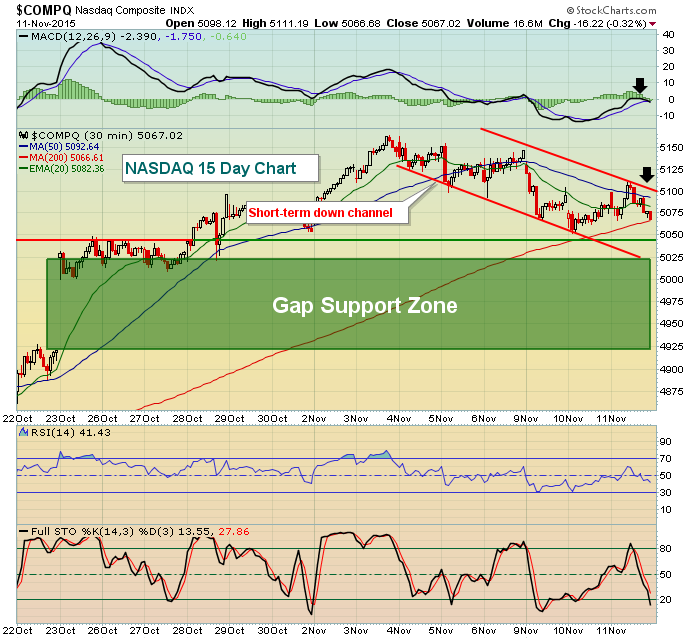
We're now in the midst of a short-term down channel and recent support has been established in the upper end of the gap support zone, or 5000-5025. Holding this range of support through this historically challenging period would be a positive for the bulls as we consolidate recent gains. A forceful break above channel resistance (currently close to 5100) would be bullish as well. The alternative would be a drop beneath 5000-5025. In that case, a further decline to test the bottom of gap support closer to 4900 should not be ruled out.
Brewers ($DJUSDB) had a very solid day on Wednesday, gaining 4.39% and easily the best performing industry group on the session. This chart also perfectly illustrates one exception to following negative divergences on the MACD. In my trading arsenal, the MACD is important, but nowhere near as important as the combination of price/volume. Check this out:
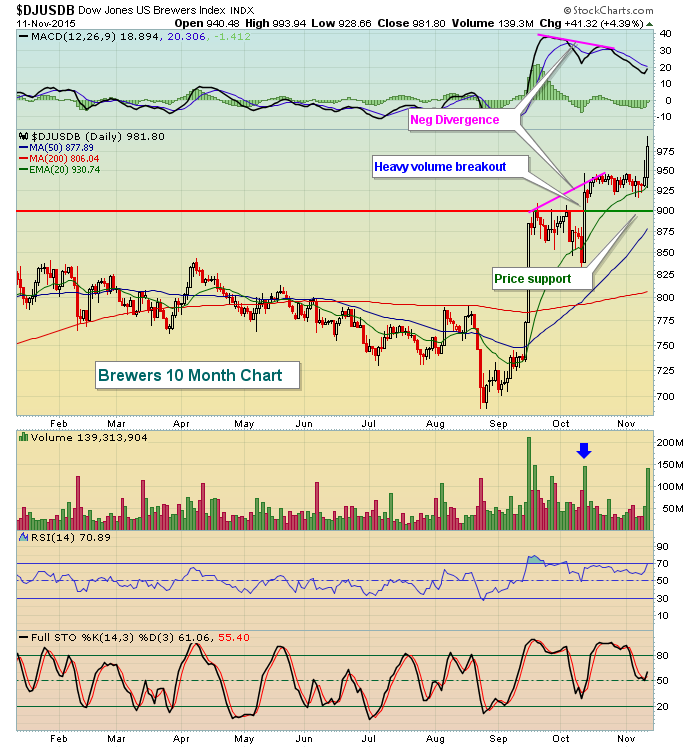
The MACD clearly shows higher price with a lower MACD reading - a classic negative divergence. But it didn't work. The reason to me is simple. First, understand that the MACD is based ENTIRELY on price action. It doesn't take volume into account on a price move, which seems somewhat ridiculous if you're trying to interpret momentum. Does anything suggest bullish momentum more than high volume accompanying a price breakout? I don't think so. In the case above, I don't completely ignore the negative divergence. What I would do is set a stop where the breakout occurs, or at 900. A true breakout now establishes price support there. Failure to hold price support with a negative divergence in play changes the technical outlook in my view. But the high volume confirmation of the breakout above 900 suggests I'd rather be long this group than short. So far that's proven to be the correct side of the trade. Had the breakout above 900 occurred on light to average volume, my opinion of the breakout would have been different.
Pre-Market Action
U.S. futures are at their morning low as indices from around the globe are lower. Asian markets were down fractionally overnight and European indices were at their session lows at last check. That's adding pressure to a U.S. market that already appears to be in profit taking mode. Throw in a slightly worse than expected initial jobless claims report this morning and limited economic news all week and you have the recipe for continuing weakness. I view the current "contained" weakness as a positive sign assuming key short-term support levels hold and expected volatility (VIX) remains contained as well. A spike in the VIX above the 18-19 level would likely encourage more selling.
While the only economic report this morning shows a hint of economic weakness, bond traders are ignoring the report as the 10 year treasury yield ($TNX) moves slightly higher once again, extending its recent uptrend. This would support the bullish theory for equities.
Current Outlook
Many times the S&P 500 takes its cue from the German DAX (or vice versa) as the chart below suggests:
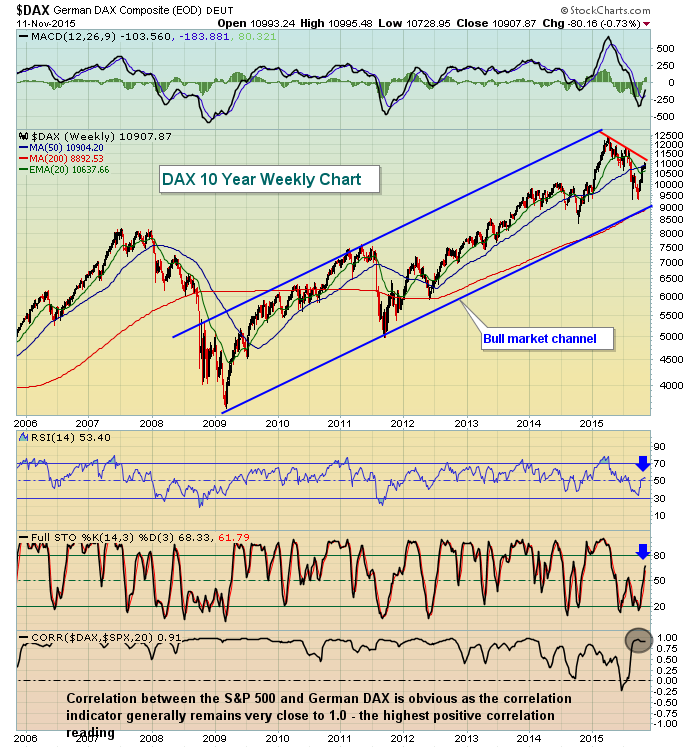
The correlation indicator tells us how closely one index trades vs. another. Are they highly correlated or not? Clearly, the S&P 500 and German DAX trade hand in hand for the most part. Therefore, if you trade U.S. stocks, you should pay close attention to what's transpiring across the pond, especially in Germany. From the chart, the DAX is closing in on a key short-term resistance area. The red line shows the approaching downtrend line (resistance) while the blue support line (channel support) has held on recent periods of selling. Generally, the longer-term trends are more powerful and persuasive. Therefore, I believe it's just a matter of time before the DAX extends through 11,000 and downtrend resistance. That, in turn, would be a boost to the S&P 500 as it looks for a catalyst to clear 2131 all-time high closing resistance. Also note the blue arrows above as they show that the DAX is nowhere near overbought levels on its weekly chart. We saw a very similar pattern at the beginning of 2012 - a rise off a correction bottom with weekly oscillators in neutral territory. The DAX rose another 20% by the second quarter of 2012. I would not be surprised to see history repeat itself here. Time will tell.
Sector/Industry Watch
The Dow Jones U.S. Exploration & Production index ($DJUSOS) is not helping the energy sector (XLE) right now. The 700-725 has proven to be a very important level of both support and resistance over the past year as the following chart reflects:
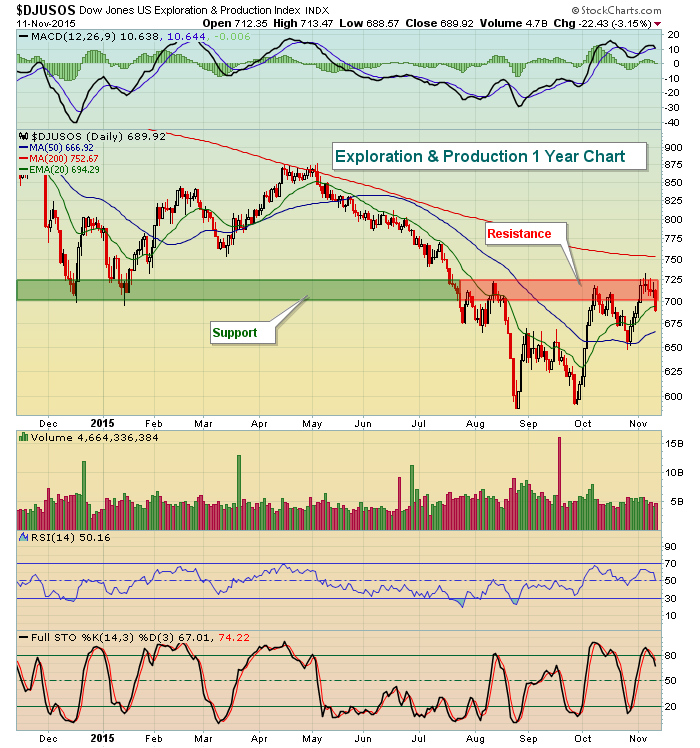
The DJUSOS had a rough day on Wednesday along with much of the energy space. A close above 725 would would be a critical blow to energy shorts so continue to watch that level. That would likely accompany the next surge higher in the XLE.
Historical Tendencies
On the S&P 500 (since 1950), the current week shows a slight bullish tendency, but next week is a different story. Here are the annualized returns for each day next week:
November 16 (Monday): -3.36%
November 17 (Tuesday): +5.63%
November 18 (Wednesday): -10.79%
November 19 (Thursday): -89.82%
November 20 (Friday): -22.92%
Each of the above days has produced annualized returns beneath the S&P 500's average 9% annual returns throughout the years so clearly this a period to at least be cautious - from a historical perspective. The good news? Once we move beyond this next week, the historical tendencies turn VERY BULLISH. Beginning Monday, November 23rd, we enter an 18 day calendar day stretch where 17 of the days carry a positive annualized return, many of which are considerably higher than that average 9% return. The stock market truly does seem to trade in a festive holiday mood from November 23rd through the end of the year with few exceptions.
Key Earnings Reports
(actual vs estimate):
AAP: 1.95 vs 2.06
ECA: (.03) vs (.04)
ENR: .61 vs .61
IGT: .41 vs .28
KSS: .75 vs .69
VIAB: 1.54 vs 1.52
(reports after today's close, estimate provided):
AMAT: .28
CSCO: .51
DDS: 1.15
FOSL: 1.13
JWN: .71
Key Economic Reports
Initial jobless claims reported at 8:30am EST: 276,000 (actual) vs. 266,000 (estimate)
Happy trading!
Tom


