Market Recap for Wednesday, December 2, 2015
Wednesday was a very difficult day for energy stocks (XLE) as this sector fell more than 3%, its worst day since the heavy August selling. The culprit is what you would expect - falling crude oil prices ($WTIC). The WTIC finished just above $40 per barrel, which was its lowest close since late August. There is significant long-term crude oil price support in the 35.00-40.00 area as reflected below:
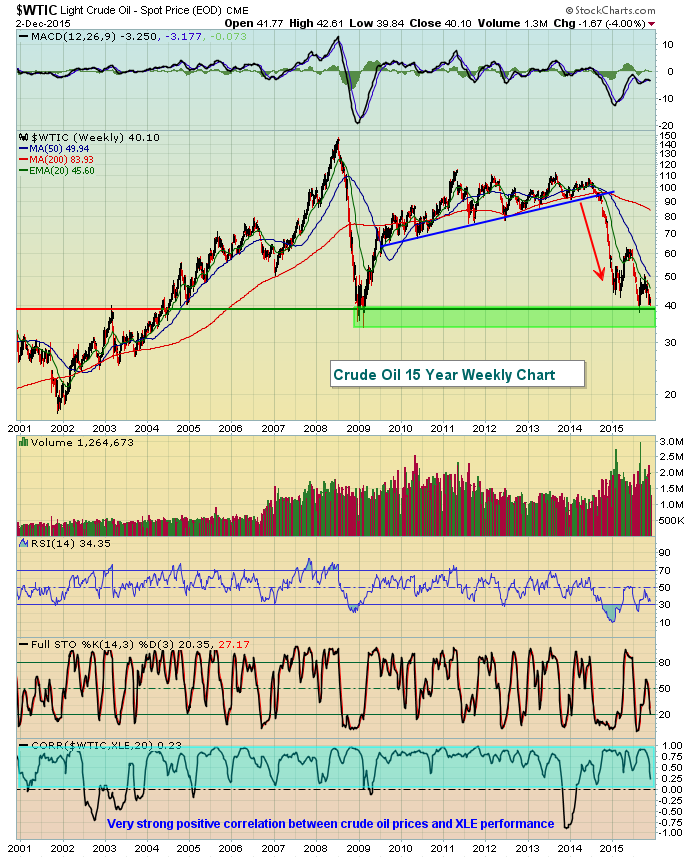
The problem with the energy sector in the second half of 2014 and throughout much of 2015 was that crude oil broke its uptrend line and cascaded lower. The XLE followed suit as it generally does. The bottom of the chart shows that there's a very solid positive correlation between the direction of crude oil prices and the movement in the XLE. The light blue shaded area shows that these two rarely move opposite one another. So the technical breakdown in the WTIC was a significant contributor in the XLE's weakness and the stalling of the S&P 500. The good news is that the WTIC has fallen back to a level where we've seen prices rebound in the past. Given the positive correlation, that's a positive for the XLE. The poor action on Wednesday sent the XLE to a close beneath its 50 day SMA for the first time since early October with key price support nearing at 65.00. I want that level to hold. If it doesn't, a trip to the upper 50s cannot be ruled out. Here's the daily chart of the XLE to illustrate:
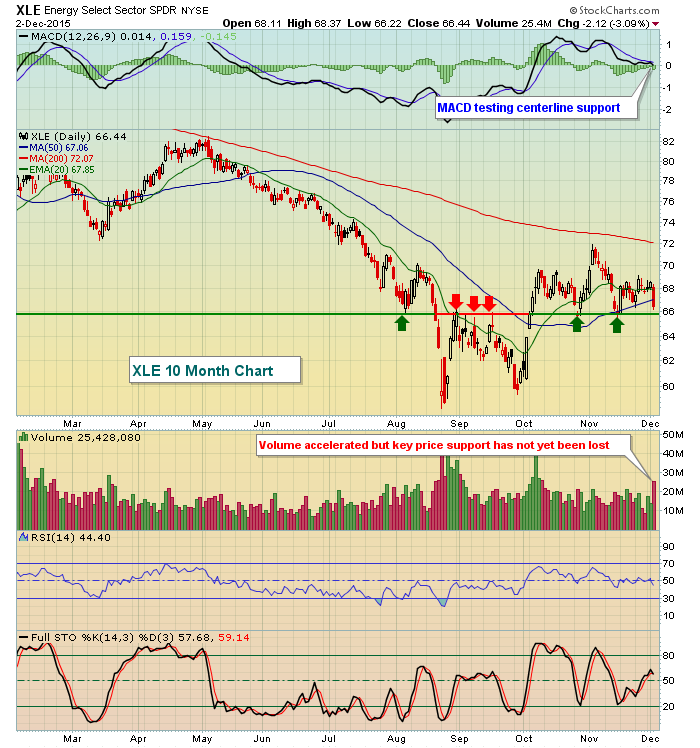
That 65.00 level shows several important short-term tops and bottoms, marked by green arrows (support) and red arrows (resistance). The loss on Wednesday carried the XLE towards that 65 support once again. It's important to hold it.
Pre-Market Action
European Central Bank President Mario Draghi indicated that the ECB will maintain its current pace of bond buying ($65 billion per month) through March 2017. The ECB extended its scope to include municipal and local debt. U.S. futures have been quite volatile since the announcement. Futures were firmly positive earlier, but moved into negative territory more recently.
Asian markets were mixed overnight and European markets have turned significantly lower with the German DAX ($DAX) down 2.3%. This weakness is clearly carrying over to the U.S. market this morning. Throw in tomorrow's important jobs report and it's clear the Fed has plenty to think about prior to its FOMC policy statement in mid-December. The recent drop in the 10 year treasury yield ($TNX) is suggesting that bond traders do not believe a rate hike is a slam dunk at this point. Failure to hike rates could once again undermine confidence in the Fed's "transparency" so remain on your toes in the very near-term, especially if short-term price support levels fail to hold. After tomorrow, history turns to the side of the bears through December 15th.
Current Outlook
All nine sectors finished lower on Wednesday so the bulls had few areas to turn to. The short-term still belongs to the bulls, however, as rising 20 day EMA offers support on the daily chart and there's been a series of higher highs and higher lows on the hourly chart. Take a look at both:
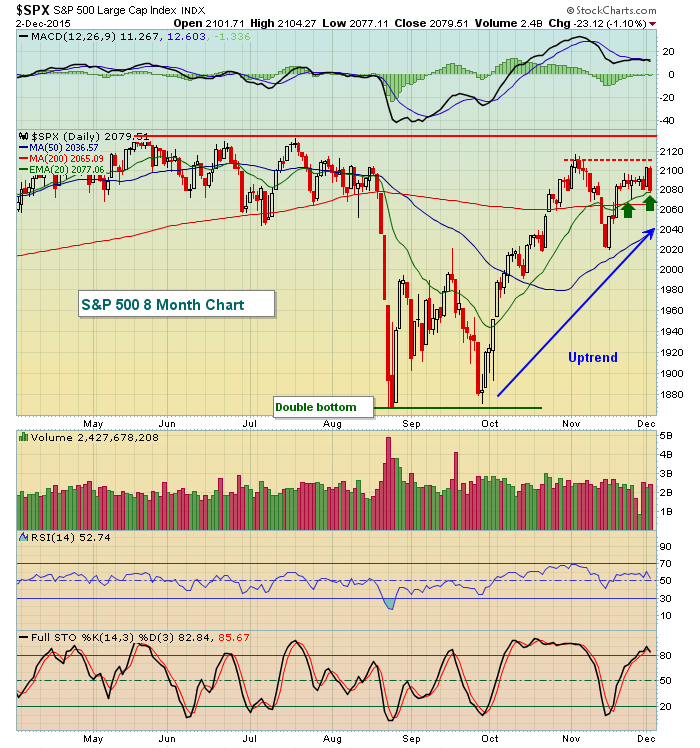
With the exception of the brief dip below the rising 20 day EMA in mid-November, price action has been very bullish off the recent double bottom. The red dotted line highlights short-term price resistance while the solid red line indicates the long-term all-time closing high resistance, obviously a much more important level in the BIG PICTURE. Recent tests of the rising 20 day EMA are holding and Wednesday's weak finish nearly reached that key moving average support. Holding it is important to the bulls in the near-term, especially if you're looking for this rise to carry all the way to 2131.
Here's the hourly outlook:
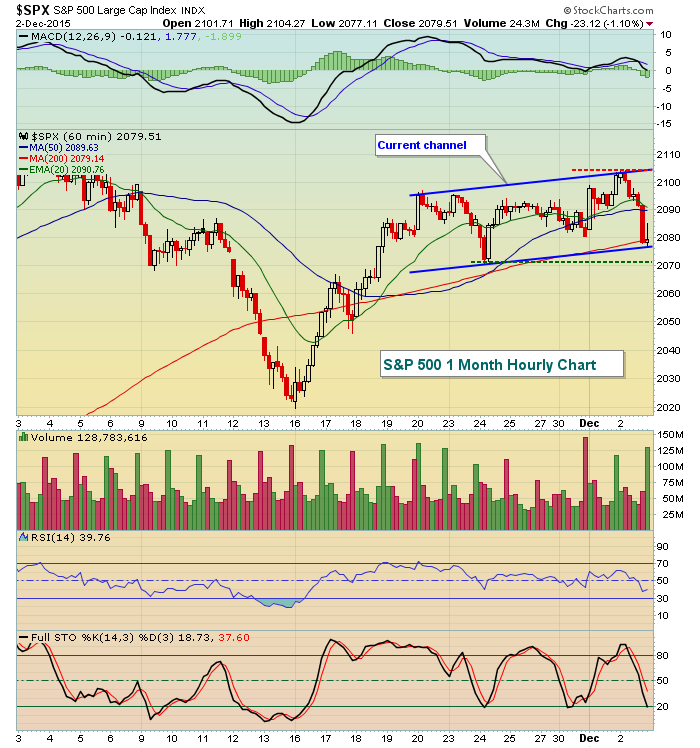
The blue parallel lines above show the S&P 500 to be in a slight up channel with higher highs and higher lows. The green dotted line shows short-term price support while the red dotted line reflects short-term price resistance.
Sector/Industry Watch
Platinum & precious metals ($DJUSPT) have been under pressure for the past two months after nearly testing its declining 50 week SMA. Given the negative divergence on the daily dollar chart (illustrated in a recent blog article), the DJUSPT nearing price support on its weekly chart could provide a short-term long opportunity. Recent lows should be respected while there's a potential move higher to above 50 to test price resistance. Check it out:
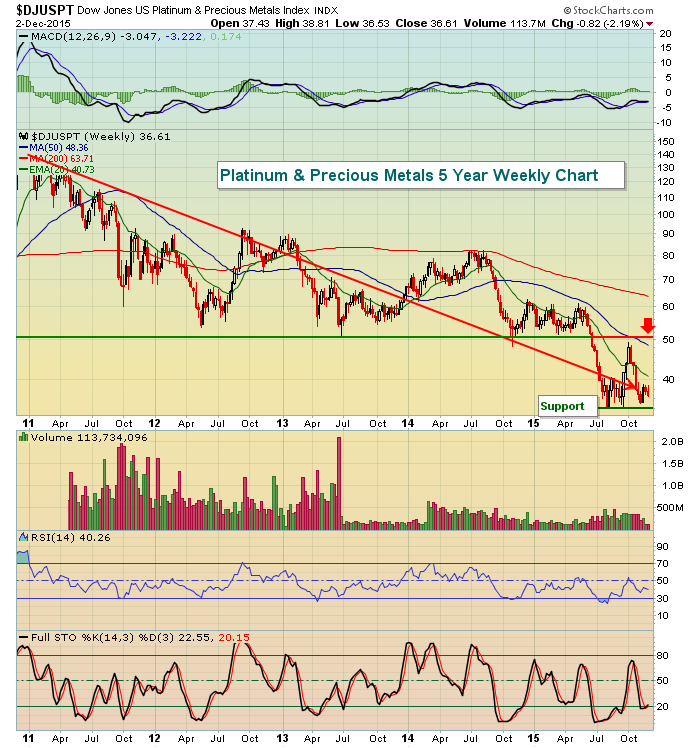
First, please recognize that red arrow pointing lower clearly shows this industry group remaining in bear market mode. But given the short-term bearish developments in the U.S. dollar, the approaching price support on the DJUSPT could provide short-term traders a solid reward to risk opportunity on the long side. Ultimately, I believe this group heads lower, but a quick pop would not be a surprise over the next couple weeks.
Historical Tendencies
Throughout history, the first six calendar days of the month carry a bullish historical bias across all of our major indices. The first and second calendar days are clearly the best, but the 3rd through 6th are also strong. Money flows are positive in the early days of a calendar month and remember that the 1st and 2nd calendar days will fall on the weekends occasionally, meaning that the 3rd and 4th become the first trading days of the calendar month. That's likely one reason why the strength continues beyond the first couple days.
Key Earnings Reports
(actual vs. estimate):
DG: .88 vs .87
KR: .39 (estimate - have not seen actual results)
MDT: 1.03 vs 1.00
TD: .87 vs .85
(reports after close today, estimate provided):
AMBA: .71
COO: 2.10
ULTA: 1.06
Key Economic Reports
Initial jobless claims released at 8:30am EST: (actual) vs. 269,000 (estimate)
October factory orders to be released at 10:00am EST: +1.4% (estimate)
November ISM non-manufacturing index to be released at 10:00am EST: 58.2
Happy trading!
Tom


