Market Recap for November 30, 2015
All of our major indices finished lower on Monday's session, but there was plenty of sector rotation. Despite the overall losses, four of the nine sectors managed to finish higher, led by energy (XLE), materials (XLB) and utilities (XLU). Technology (XLK) also ended the day higher. Healthcare (XLV) was the worst performing sector, dropping 1.36% and the XLV remains perhaps the most technically-challenged of all the sectors. The XLV did look similar during the last correction in 2011 though. Take a look at the longer-term weekly chart:
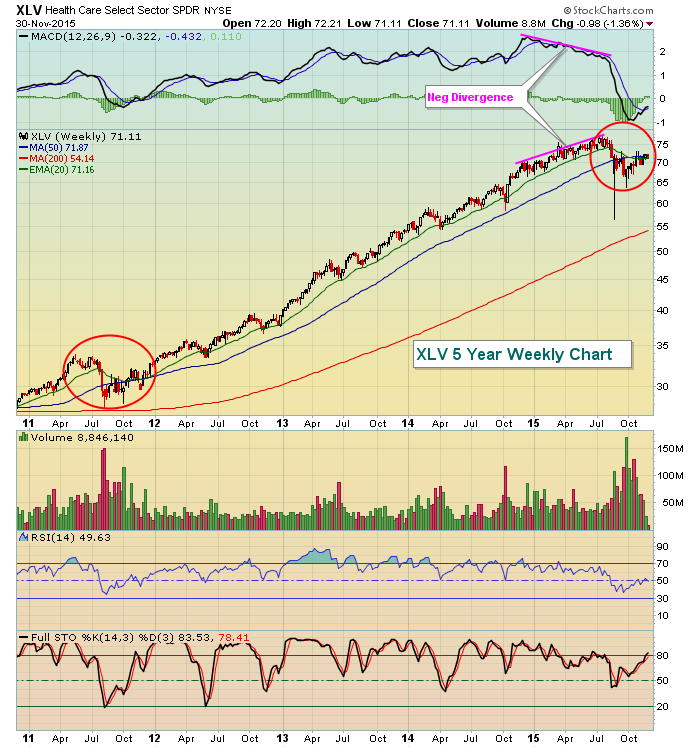
The drop in 2011 occurred on heavy volume and saw an impulsive selling episode that took the sector below key moving averages and with a drop in its weekly MACD beneath centerline support. However, the bull market resumed and healthcare was one of the best performing sectors over the next few years. But slowing momentum became a huge concern in 2015 as high after high was accompanied by lower MACDs and these weekly negative divergences must be respected. I wrote an article in early June discussing the warning signs that the weekly MACD was providing us. The article, "Healthcare Stocks Are Vulnerable To Weakness Ahead" detailed the fact that all five industry groups within the healthcare space printed negative divergences simultaneously on their respective weekly charts. These warning signs do not provide us guarantees. Rather, they simply alert us to the fact that risks are high. If you hold as weekly negative divergences continue to mount, you're taking on considerable risk.
Pre-Market Action
Asian markets were strong overnight, while European markets are mixed. There are a few economic reports out this morning, but traders are awaiting the Friday jobs report for sure. The timing of that report is very interesting because historically the only weak part of December follows. Depending on the index, December 7th to December 15th represents a period of profit taking.....or outright selling. Typically that's followed up with a solid advance into year end, however.
Treasuries are slightly lower this morning with the 10 year treasury yield ($TNX) continuing to hover near that 2.23% level.
Joy Global (JOY) is down nearly 5% after being downgraded by Bank of America/Merrill Lynch. On the flip side, Infoblox (BLOX) is soaring after a very solid quarterly earnings report, raised guidance and a $100 million share repurchase program.
Current Outlook
The dollar ($USD) is likely to have an impact on energy and materials as it usually does, especially the latter sector. The chart on the USD is quite interesting currently. The longer-term weekly chart is very bullish while the daily chart is growing a bit more suspicious. My interpretation is that we may have a bit more upside on the USD but look for price resistance and an emerging negative divergence to contain the bulls for awhile. Below is a weekly chart of the long-term, followed by a daily chart. Check them out:
USD weekly chart:
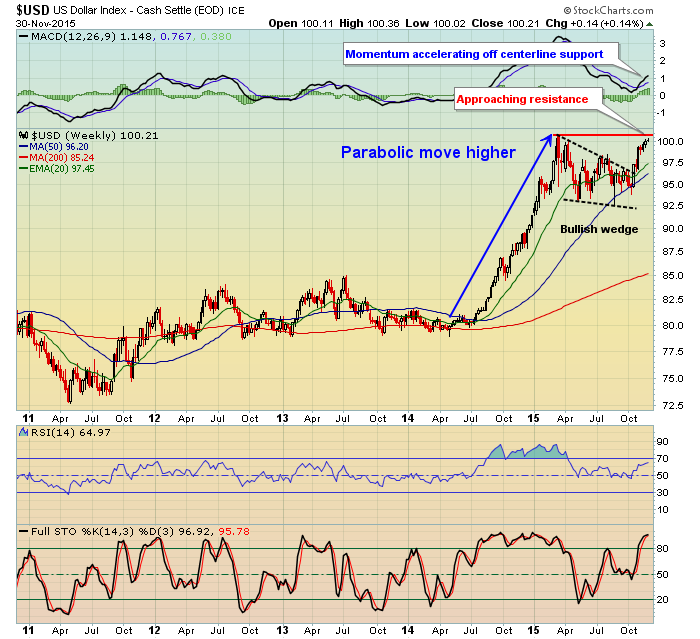
There's a lot to like here. First, we're clearly in an uptrend as the recent parabolic rise shows. We consolidated in a bullish wedge before breaking out of it in October. The consolidation phase allowed the weekly MACD to work its way back to centerline support to effectively "reset" momentum to zero. The uptrend has now resumed as the dollar nears resistance just above 100. What's not to like? Well, perhaps the daily chart.......
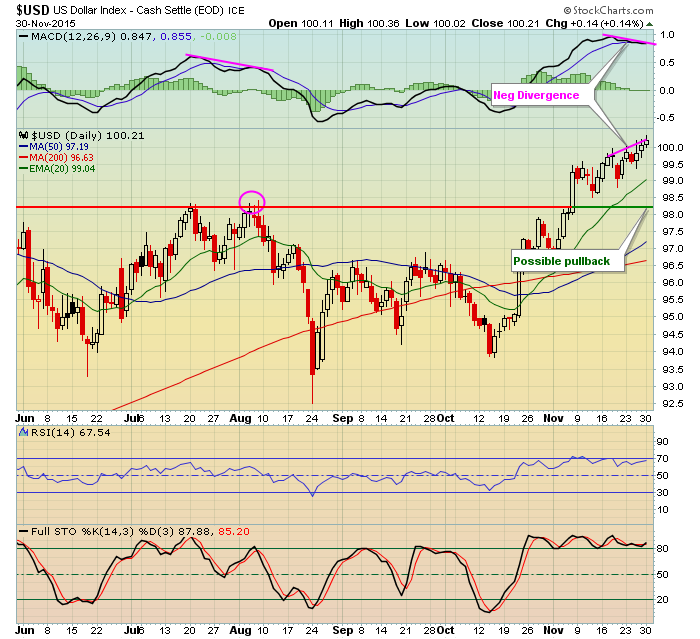
The MACD in early August was also suspicious, but that was not technically a negative divergence because it requires a higher CLOSE. The pink circle shows intraday highs that eclipsed prior highs, but there were no fresh closing highs. Still, it gives the appearance of slowing momentum. In early November, we broke out but recent closing highs are accompanied by a lower daily MACD - this is most definitely a negative divergence. This negative divergence on the daily chart is occurring at a time when we're approaching long-term price resistance on the weekly chart. So it makes sense for the USD to perhaps pause for a bit here. I've been a BIG BEAR of gold (GLD) for the past three years, ever since it broke down beneath major price support at 150. Gold has a history of moving opposite the dollar. Therefore, a potentially weakening dollar near price resistance could be short-term good news for gold bulls. Please don't misinterpret me. I believe GLD will continue to head lower in time. But given the obstacles in the dollar over the coming days and weeks, it's certainly possible that GLD will see some relief - perhaps into year end.
Sector/Industry Watch
Over the past three months, drug retailers ($DJUSRD) represents the only industry group within consumer staples that's moved lower. The DJUSRD is down 5.6% and currently shows little technical strength. Here's a long-term weekly chart showing the two areas I'd like to see either tested to taken out before I'd grow more bullish the group:
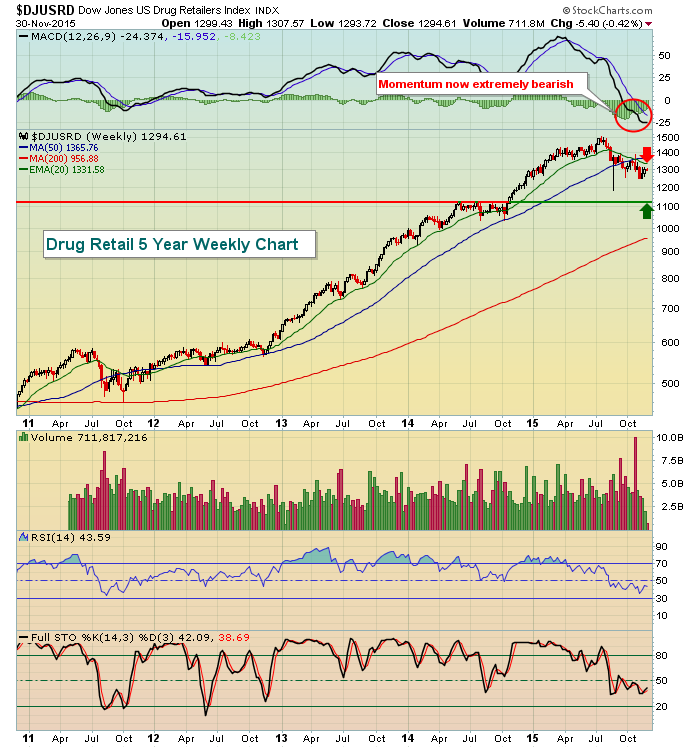
This chart puts things into perspective. The DJUSRD has not been a weak industry group. In fact, check out the move from 600 to 1500 in just 2 1/2 years - that's VERY bullish! But bull markets see lots of sector and industry group rotation and the drug retailers are now caught up on the wrong side of it. So yes the 5.6% drop in the past three months is bad, but the group needed a chance to catch its breath. Follow those two arrows above. The green arrow marks price support from the October 2014 breakout. That level has never been retested. To the upside, the red arrow marks that declining 20 week EMA. The weekly MACD is very weak so I'd be careful owning anything related to this industry group until that changes.
Historical Tendencies
As we enter December, here are the annualized returns for the month for each of the following indices:
S&P 500 (since 1950): +20.10%
NASDAQ (since 1971): +23.99%
Russell 2000 (since 1988): +40.18%
Key Earnings Reports
(actual vs. estimate):
BMO: 1.44 vs 1.32
BNS: 1.11 vs 1.09
(reports after close, estimate provided):
BOBE: .40
Key Economic Reports
November PMI manufacturing to be released at 9:45am EST: 52.6 (estimate)
November ISM manufacturing to be released at 10:00am EST: 50.5 (estimate)
October construction spending to be released at 10:00am EST: +0.6% (estimate)
Happy trading!
Tom


