Market Recap for Wednesday, March 16, 2016
Energy (XLE) closed at more than a three month high on Wednesday, gaining 1.73% on the session to lead all sectors. Utilities (XLU) were a strong second as they climbed 1.53%. The XLU clearly benefited from the reaction in treasuries to the FOMC announcement. Treasury prices rose and that sent yields tumbling. The 10 year treasury yield ($TNX) was near 2% as Fed Chair Yellen delivered the latest Fed statement, but it immediately dropped to 1.92% as bond traders viewed the policy statement as a sign of further economic weakness ahead. The S&P 500, however, closed at 2027, its highest level of 2016. The S&P 500 is now more than 200 points off its February 11th low and roughly 100 points away from its all-time high close. Normally, we see the TNX and SPX move in unison over the near-term, but that certainly was not the case Wednesday afternoon as you can see below:
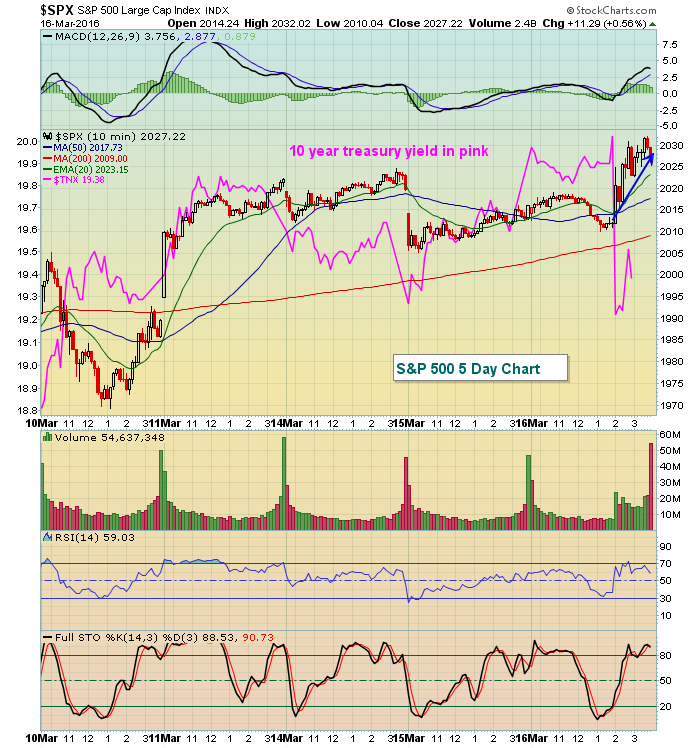 At 2pm, the S&P 500 surged higher (blue line) on the heels of the Fed announcement. Note the sudden drop in the 10 year treasury yield though? The bond and equity markets were interpreting the announcement quite differently and I typically listen closer to the bond market's opinion. Therefore, I question that reaction in the equity markets yesterday afternoon - especially if treasuries continue to be bought today.
Financials (XLF) and healthcare (XLV) both lagged on Wednesday, the only two sectors to finish in negative territory. Banks ($DJUSBK) were down close to 1% and pharmaceuticals ($DJUSPR) dropped a little more than 1% to lead those two sectors lower. The DJUSPR is featured below in the Sector/Industry Watch section.
Pre-Market Action
A couple of fairly solid economic reports this morning has done little to stem the tide of selling as U.S. futures are down to mirror action we're seeing across Europe. Futures have improved since both jobless claims and the Philadelphia Fed survey beat expectations, but they remain lower nonetheless.
In Europe, the German DAX is down 1.62% at last check while the French CAC is lower by 1.26%. More modest losses persist in the London FTSE.
The action in Asia overnight was more positive, especially in China and Hong Kong where their markets saw gains of approximately 1.2%.
The 10 year treasury yield ($TNX) has dipped back below 1.90% as money continues to rotate towards treasuries, a defensive move.
Current Outlook
Transportation stocks ($TRAN) have been strong coming off the February lows, especially the truckers ($DJUSTK). Here's a chart that shows both positives and negatives:
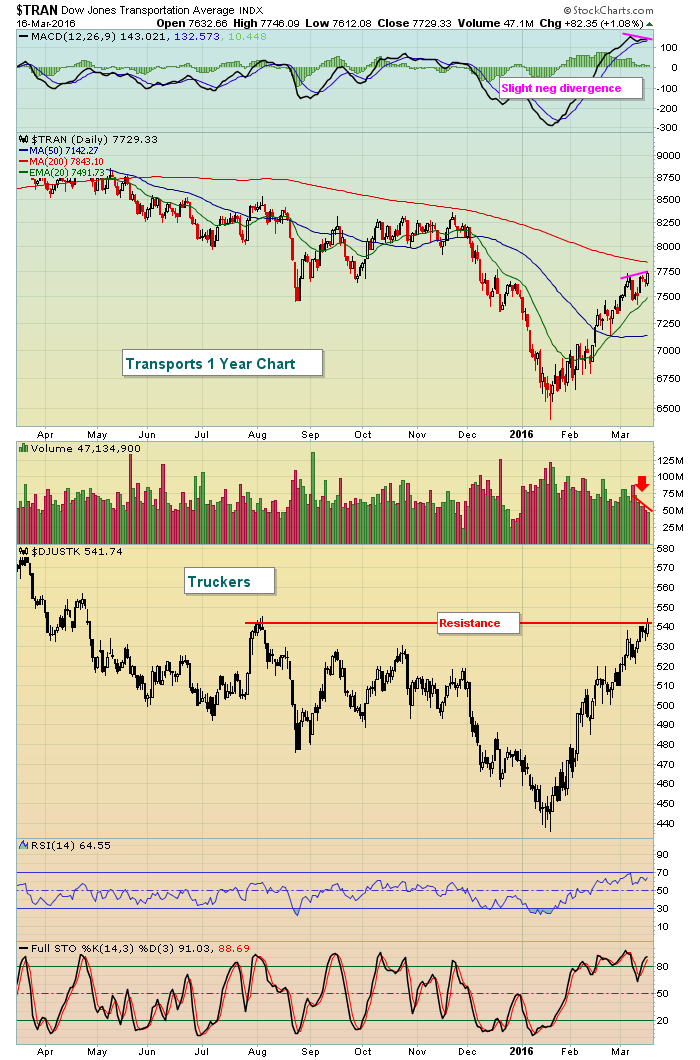 The performance of transportation stocks is important for one very apparent reason. Transportation provides us insight into our domestic economy. The market looks forward so strength in transportation can be viewed as endorsement of a strengthening economic outlook. The Dow Jones U.S. Transportation Index ($TRAN) has risen close to 20% off its January low. The Dow Jones U.S. Trucking Index ($DJUSTK) has jumped close to 25% in just the past two months. What could be wrong? Well, first understand that both of these indices were crushed just prior to this strength so an oversold bounce was to be expected. On the TRAN, a slight negative divergence has emerged and that suggests slowing momentum. The declining volume on the latest push higher would confirm that. The DJUSTK has been the leader among transport stocks and that index is now testing overhead price resistance and is very overbought (not shown above but daily RSI is 70 and stochastic is 93. Weekly stochastic is 97).
Then there's the relative performance of transportation to utilities ($TRAN:$UTIL):
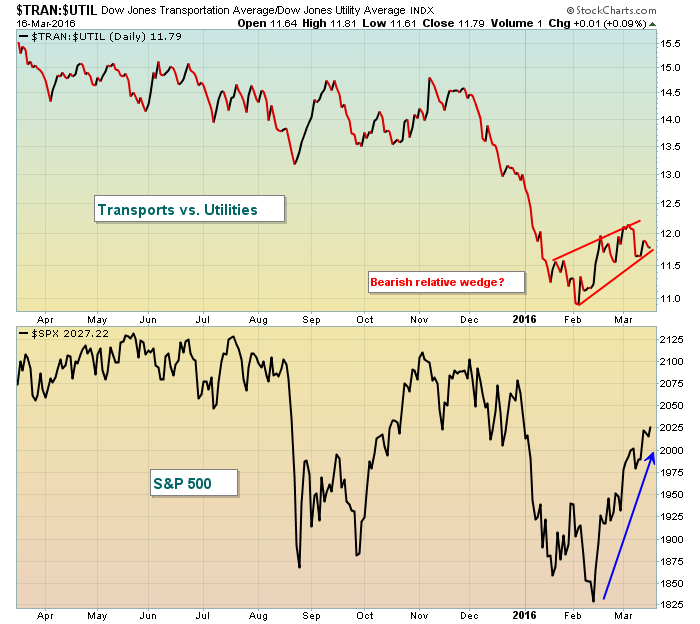 It would seem the rebound in the S&P 500 has been a lot stronger than the rebound in the TRAN:UTIL and that tells us that market participants are not fully committed to a strengthening economy ahead - instead, just the opposite. That's the same thing that low treasury yields are suggesting as well. Remain cautious.
Sector/Industry Watch
Healthcare (XLV) has struggled since printing negative divergences on weekly charts in the first half of 2015. The downtrend in most areas of healthcare is obvious. I featured biotechs ($DJUSBT) recently. Today, take a look at pharmas ($DJUSPR):
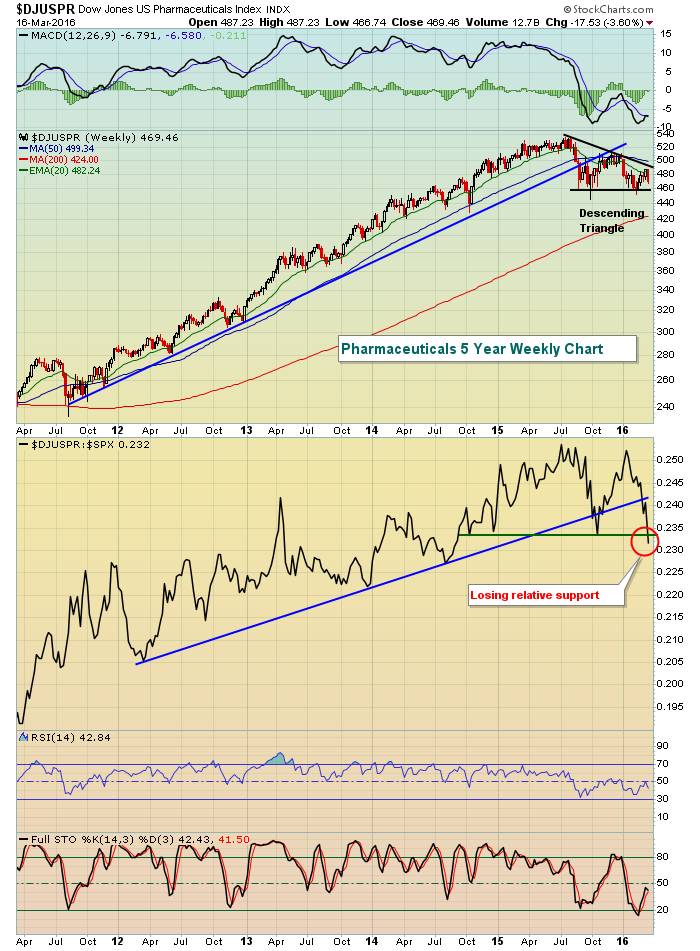 The break of relative support shouldn't be ignored and neither should the price support level of the current descending triangle pattern. We could see a bullish breakout to the upside, but I prefer the ascending triangle pattern over the descending pattern if I'm in the bullish camp.
Historical Tendencies
I've mentioned previously that the current week is historically bullish. But once we move past tomorrow, the annualized return for the balance of March (19th through 31st) is -3.66% since 1950. That's nearly 13 percentage points below the S&P 500's 9% average annual return. Also, the percentage of up days vs down days for this period is just 45.92%.
Key Earnings Reports
(actual vs. estimate):
IGT: .63 vs .42
(reports after close, estimate provided):
ADBE: .47
Key Economic Reports
Initial jobless claims released at 8:30am EST: 265,000 (actual) vs. 270,000 (estimate)
Philadelphia Fed Survey released at 8:30am EST: 12.4 (actual) vs. -1.4 (estimate)
February leading indicators to be released at 10:00am: +0.2% (estimate)
Happy trading!
Tom


