Market Recap for Tuesday, April 26, 2016
April has not been kind to technology stocks (XLK). We've seen several key earnings disappointments from the group, including Microsoft (MSFT), Alphabet (GOOGL) and Apple (AAPL), and investors in those three are not happy. We've seen bifurcated action throughout April where energy (XLE), materials (XLB) and financials (XLF) have produced gains of 8.91%, 6.46% and 6.01%, respectively, to lead the Dow Jones and S&P 500 to outsized gains while technology has dropped .87% to join consumer staples (XLP) and utilities (XLU) as the only sectors that are down over that same one month period. The following chart shows just how bad the NASDAQ 100 ($NDX) performance has been vs. the S&P 500:
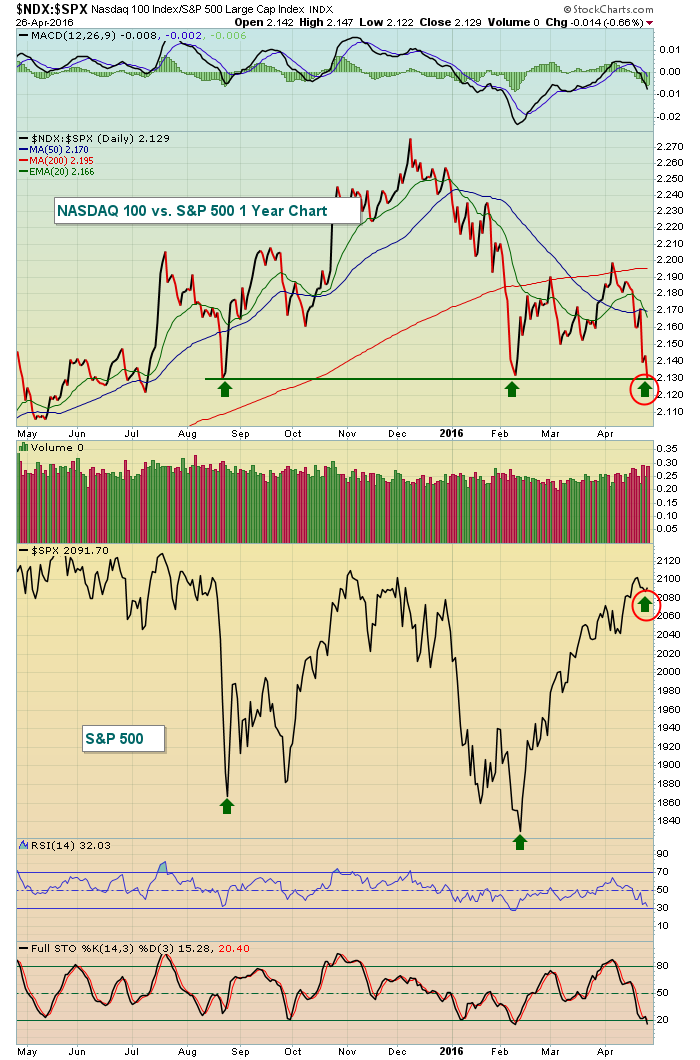 The NASDAQ 100's relative performance (vs. the S&P 500) hit its lowest level since August on Tuesday and given the relative weakness in NASDAQ futures this morning on the heels of AAPL's dismal report, it's fairly safe to say a new relative low will be reached today. The interesting thing about this chart is that the prior two relative lows on the NDX:SPX occurred when the entire market was selling off at the flash crash August low, then again in early February when the S&P 500 threatened to lose 1800 price support. But now the relative weakness is occurring with the S&P 500 nearing an all-time high. In other words, the appetite for stocks is much improved, but investors simply want little to do with the large cap NASDAQ names and that's very unusual.
Tuesday's action with the NASDAQ underperforming in a big way simply underscores what market participants have been witnessing throughout April and really since 2016 began. No one wants to take chances owning those companies dependent on strong revenue and EPS growth.
Technology led to the downside on Tuesday as the XLK fell 0.48%. Energy, meanwhile, was busy posting yet another 2016 closing high, gaining 1.60%.
Pre-Market Action
Normally, the action is fairly quiet on FOMC announcement day, but AAPL's earnings shortfall and outlook surprised many and AAPL is lower by 8% in pre-market trading. The last trade at 96.04 is still comfortably above key price support near 92.50-93.00. We'll need to watch carefully over the next few days and weeks to see if support continues to hold. It's difficult to imagine the overall market breaking out to fresh all-time highs if AAPL is losing major price support, but this bull market continues to defy odds. Take a look at AAPL's critical support:
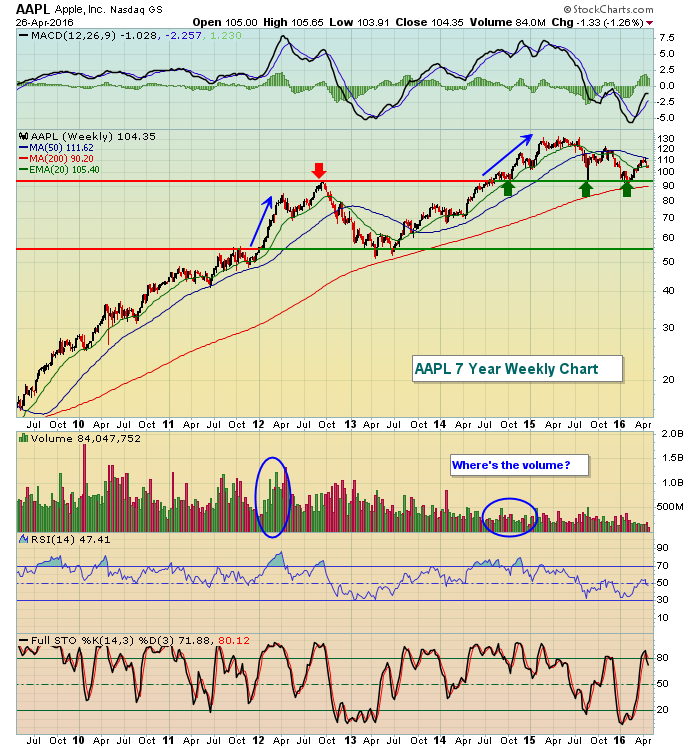 Perhaps the most alarming aspect of this chart is the total lack of volume to support AAPL's last breakout above the 93 level. So losing that support, especially on increasing volume, would be a major warning sign to me.
U.S. futures are weak as we'd expect, with most of the weakness concentrated in technology and the NASDAQ. Thus far, the news of AAPL's troubles have done little to shake global markets. Asian markets were down overnight, but were contained. And this morning, we see European indices higher. So while company-specific news may have a short-term negative effect, global markets continue to remain optimistic in light of central bankers' willingness to lend a helping hand in times of need. At 2pm EST today, we'll get the latest policy statement from the FOMC here in the U.S.
Current Outlook
While the relative price action on the NASDAQ and NASDAQ 100 ($NDX) is well-documented above, the actual price action hasn't done anything extraordinary. In fact, the NDX is one of several major indices that printed a negative divergence on its daily chart and today's weakness at the opening bell may deliver the 50 period SMA test that I look for after negative divergences emerge. Check out the chart:
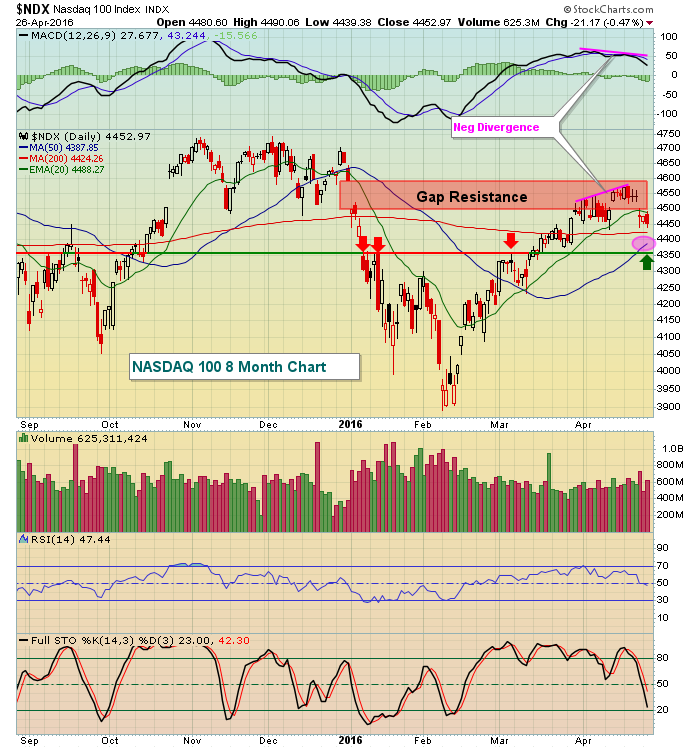 As we headed into April, the NDX was overbought with its RSI and stochastic at roughly 70 and 90, respectively. Then the next price high resulted in a negative divergence and all of this occurred in an important gap resistance zone. So the NDX turning lower to head for its 50 day SMA (pink circle) isn't a shocker. The biggest surprise is the fact that the NDX has been leading to the downside while the overall market has held up for the most part. There's only one thing that makes sense to me - the fact that little is making sense.
We'll likely see the 50 day SMA test today. But once we get there, will buyers return? I've marked 4350 as a fairly significant "line in the sand" for the NDX. That level was key resistance on the move higher earlier this year (red arrows) so it will be important for the bulls to defend that level on any further selling pressure.
Sector/Industry Watch
With the Fed set to deliver its latest directive on interest rates, we'll need to be prepared, especially in those sectors and industries that are more interest rate sensitive. Utilities (XLU) is one such sector. As treasury yields rise, the XLU tends to suffer as dividends on utility stocks appear less attractive if safer treasuries see their yields rise. Rising treasury yields also suggest economic improvement ahead and during such periods, more aggressive equities tend to outperform more conservative alternatives like utilities. Therefore, more selling in the group generally ensues. Once the FOMC announcement is made, it'll be interesting to watch to see how treasuries react. The TNX closing back above 2.00% would not be good for utilities and likely extend their recent slump. Here's the current look at technicals:
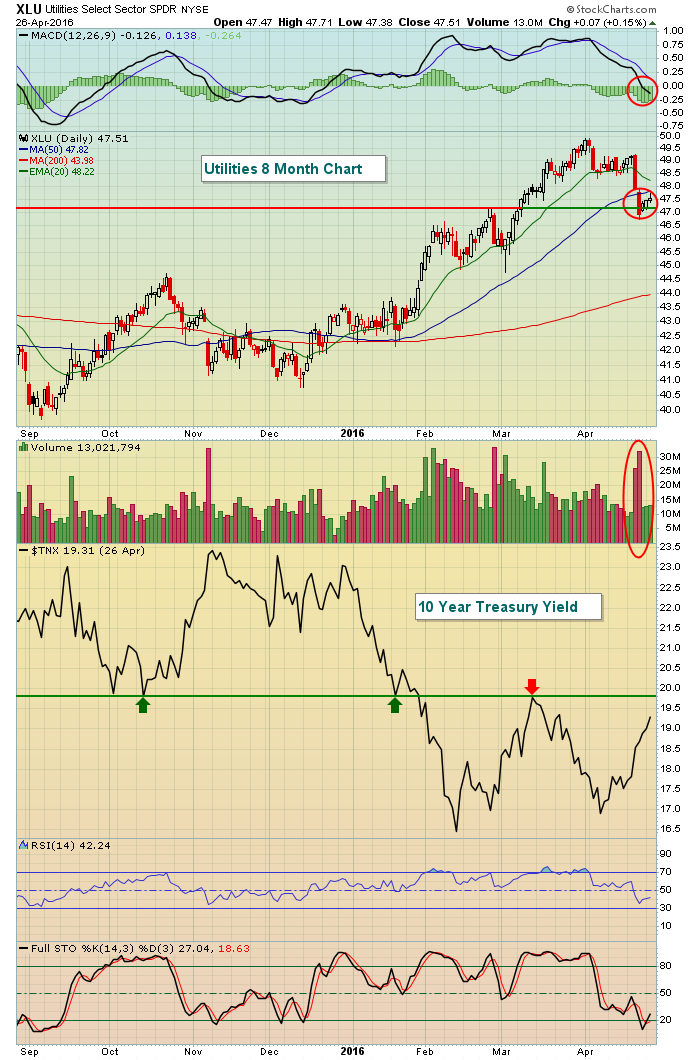 The XLU broke down on heavy volume below its 50 day SMA and its MACD turned negative so further fundamental damage, along with a price breakdown beneath recent lows should be respected.
Historical Tendencies
Beginning tomorrow, the NASDAQ enjoys one of its best historical weeks of the year. Here are the annualized returns for each of the next eight calendar days:
April 28 (Thursday): +6.97%
April 29 (Friday): +61.48%
May 2 (Monday): +59.36%
May 3 (Tuesday): -28.41%
May 4 (Wednesday): +45.40%
May 5 (Thursday): +82.54%
Key Earnings Reports
(actual vs. estimate):
BA: 1.74 vs 1.81
BHI: (.44) vs (.33)
CMCSA: .84 vs .79
DPS: .94 vs .86
GD: 2.34 vs 2.14
GRMN: .49 vs .43
IP: .80 vs .69
NOC: 2.77 vs 2.47
ROK: 1.37 vs 1.32
SO: .58 vs .53
UTX: 1.47 vs 1.39
(reports after close, estimate provided):
FB: .44
FSLR: .87
MAR: .84
ORLY: 2.49
PYPL: .30
SNDK: .43
TXN: .62
UNM: .90
XLNX: .52
Key Economic Reports
March pending home sales to be released at 10:00am EST: +0.5% (estimate)
Happy trading!
Tom


