Market Recap for Wednesday, June 29, 2016
U.S. equities rallied strongly on Wednesday, following the lead of global indices as the shock of Brexit begins to wear off. The German DAX ($DAX) was able to close at its highest level since Brexit, clearing the 9557 close the day after the vote. It was an important psychological achievement and that's helped to enable bulls around the globe to rally. Here are the hurdles to watch as we move forward in Germany:
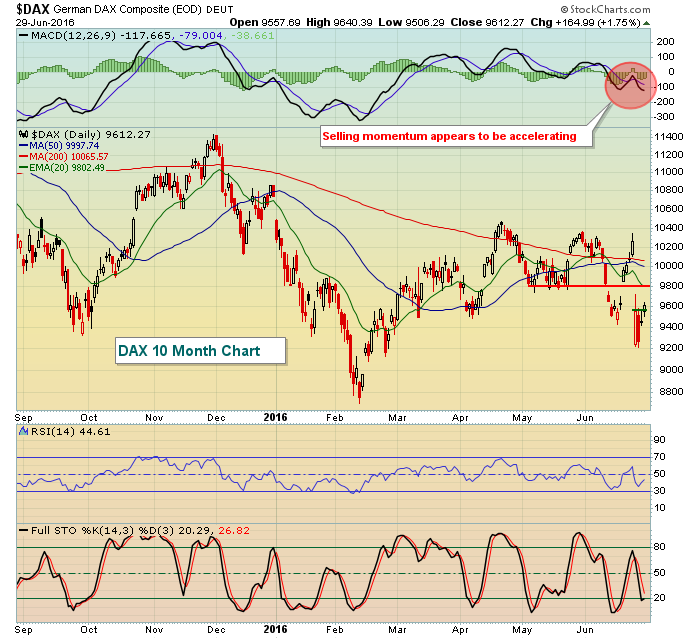 The green horizontal line marked 9557 closing resistance, which was cleared at the close on Wednesday. The red horizontal line marks key price resistance near 9800 and also the declining 20 day EMA, currently at 9802. That should prove very difficult for the bulls to negotiate on any further upside. The reason that I watch the DAX so closely is that there is a very strong positive correlation between the performance of the DAX and the performance of the S&P 500. Failure to break out on the DAX and a subsequent move lower would likely lead to the same result here in the U.S.
As far as equity performance here on Wednesday, financials (XLF, +2.27%), healthcare (XLV, +1.91%) and energy (XLE, +1.90%) were the leading sectors. A very oversold group of banks ($DJUSBK), life insurance companies ($DJUSIL) and asset managers ($DJUSAG) led the financial rally. It was merely an oversold bounce, however, as no major technical hurdles were cleared with the strength. Therefore, it's difficult to assume this strength will continue. Healthcare was led by all industry groups, including biotech ($DJUSBT) stocks, which hit major price support from February near the 1500 level on Tuesday. They simply continued that bounce on Wednesday. Finally, energy has been a stalwart in 2016 and that relative strength simply resumed yesterday. This sector remains quite strong technically.
Pre-Market Action
Global markets are settling down with very minor gains and losses in most major indices. World markets were rattled by Brexit, but have mostly rallied the past two days, defying the technical odds and gravity, which seemed poised to carry prices lower.
The equity rally here in the U.S. has occurred despite money remaining in the treasury market. We have not seen an exodus there, which would lead to higher treasury yields. Instead, the 10 year treasury yield ($TNX) continues to hover just below 1.50%. It would help to confirm the equity rally if the TNX would rise back above the 1.60% level, but there's still plenty of work left there.
Current Outlook
Just looking at the point rally in the Dow Jones and S&P 500, it's easy to be excited about the rally the past couple days. But we cannot ignore the heavy volume that accompanied the selling and recent price support lost. That suggests the bears have captured the momentum and the daily MACD confirms that notion. Therefore, the declining 20 day EMA test becomes very important technically. A reversing candle after moving above the 20 day EMA intraday would be a bearish signal and one that I would not take lightly. Also, the VIX dropped more than 11% on Wednesday, but has reached its support level near 16.50. Watch the VIX closely to see if expected volatility begins to rise again. If so, we'll likely see the S&P 500 retreat as well. Check out both below:
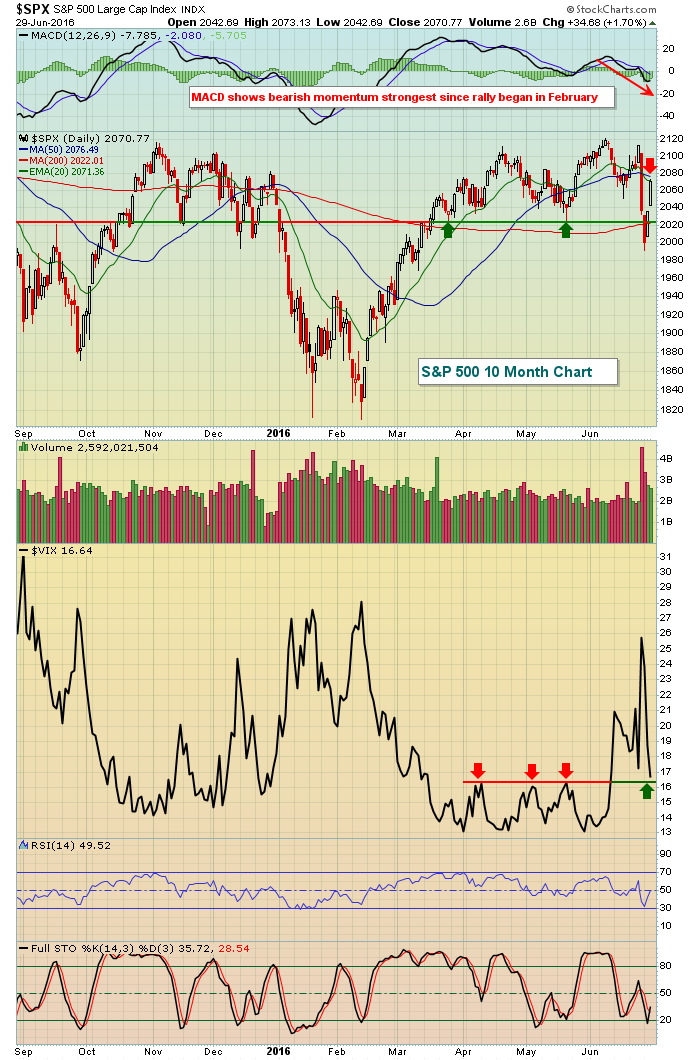 The rally on the S&P 500 above 2025 was a good start technically to repairing the damage caused by Brexit. But there's more work to do and today we may find out whether the bulls are strong enough to keep the rally going. The 20 day EMA and 50 day SMA are at 2071 and 2076, respectively, and clearing both would add substance to this rally. I'd also like to see more relative strength in certain areas (XLY:XLP, TRAN:UTIL, etc). The VIX has support just below Wednesday's close, so a bounce in the VIX from 16-17 support would make it difficult for equity bulls.
Sector/Industry Watch
The Dow Jones U.S. Tires Index ($DJUSTR) has broken down over the past few trading sessions and it's seen little recovery over the past two days. Will it recover? History says yes as you'll see below in the Historical Tendencies section, but what do the technical indications tell us:
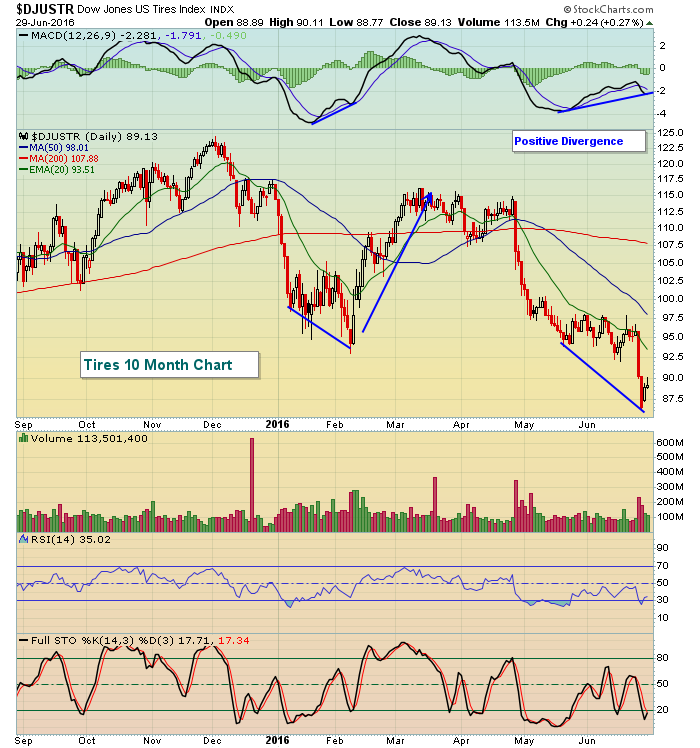 The last positive divergence in February resulted in a solid rise over the next month. Will we see a repeat? Stay tuned.
Historical Tendencies
The Dow Jones U.S. Tires Index ($DJUSTR) has been one of the best performing industry groups during the month of July over the past 16 years with an average July return of 4.3%. I've highlighted the current technical outlook for the group above in the Sector/Industry Watch section.
Key Earnings Reports
(actual vs. estimate):
CAG: .52 vs .52
DRI: 1.10 vs 1.08
MKC: .75 vs .74
PAYX: .49 (estimate, haven't seen actual EPS yet)
STZ: 1.54 vs 1.51
Key Economic Reports
Initial jobless claims released at 8:30am EST: 268,000 (actual) vs. 266,000 (estimate)
June Chicago PMI to be released at 9:45am EST: 50.5 (estimate)
Happy trading!
Tom
