Special NOTE
Please check out the Historical Tendencies section below for important seasonal information as we approach the bearish month of September. There are a couple of important links - one to join me for my webinar today at 1pm and also one to join us at StockCharts.com for a "can't miss" online ChartCon event. It's the first of its kind and I'd love to have you join us. Check it out below!
Market Recap for Friday, August 26, 2016
There was a big selloff in treasuries on Monday as the 10 year treasury yield ($TNX) surged to its highest level since late June, clearing important 1.60% yield resistance in the process. It did little to encourage equity buying, however, as our major indices finished in bifurcated fashion with the NASDAQ gaining ground, while the Dow Jones, S&P 500 and Russell 2000 each took it on the chin. But check out the breakout in the TNX before we discuss equity performance:
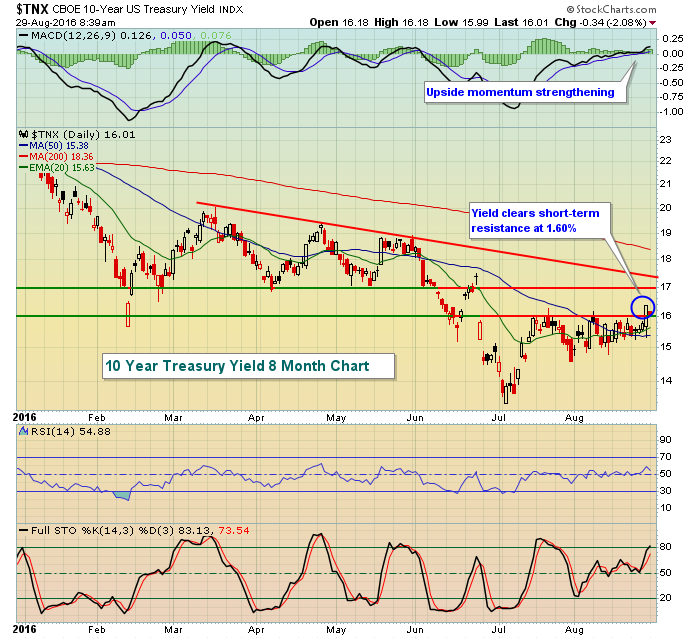 Clearly, the TNX breakout is one of a short-term nature and there's much more work to be done, as reflected by the confluence of yield resistance at the TNX approaches 1.70%. Rising yields tend to be bullish for equities for two reasons. First, money flows OUT of treasuries to create the rising yield and that money tends to find its way into equities. Second, rising yields normally are in anticipation of a strengthening U.S. economic picture and that economic environment typically sends profits higher for U.S. stocks.
The equity reaction on Friday was muted, however. There was a mixed picture in financials (XLF, +0.12%) as banks ($DJUSBK), asset managers ($DJUSAG), investment services ($DJUSSB) and life insurance ($DJUSIL) all finished in positive territory as rising yields generally are accompanied by strength in those industry groups. REITs, on the other hand, are treated rudely as treasury yields rise as REIT dividend yields look less attractive when their treasury yield alternative rises. Likewise, utilities (XLU, -2.07%) were in the dumps on Friday for the same reason. Utilities have been acting much more bearishly of late as you can see below:
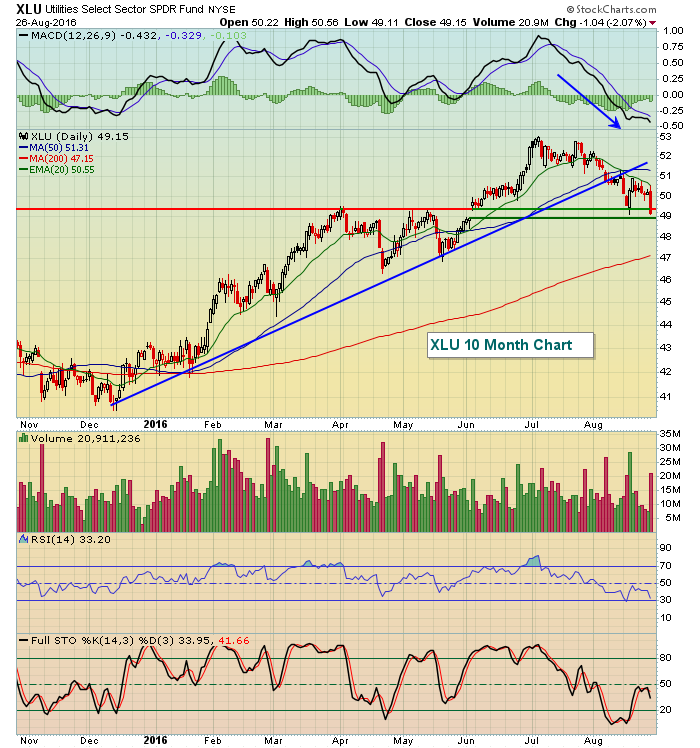 Since breaking trendline support two weeks ago, a series of negative technical events have taken place. There has been a death cross where the 20 day EMA has crossed beneath its 50 day SMA. Also, check out the failures at the declining 20 day EMA recently and the increasing volume on down days. The biggest technical development in my opinion, though, would be the loss of both price and gap support in the 49.00-49.50 range. The XLU closed at 49.15 on Friday so the urgency is there for the bulls. The fact that technical conditions have turned so negative here is a potential sign that traders are expecting the recent uptrend in treasury yields to continue.
Pre-Market Action
Overnight, the Tokyo Nikkei ($NIKK) surged nearly 400 points on a weaker yen, but the overhead resistance near 17000 remains. Other Asian markets were mixed. In Europe this morning, the key indices there are mixed as well although the German DAX price action is still above key price support in the 10450-10500 range.
The 10 year treasury yield ($TNX) has fallen back to 1.60% after a huge spike on Friday. Crude oil ($WTIC) is back below $47 per barrel as it's dropped 1.5% at last check. That will likely put pressure on the energy group today.
U.S. futures are fairly flat as we open a new trading week. Technically, however, the bears have begun to regain the upper hand so watch carefully today to see if the price lows on Friday hold. If not, I'd expect to see selling accelerate. The 2144 level marks the 50 day SMA on the S&P 500, while price support is at 2131. That "support zone" looms large.
Current Outlook
The S&P 500 is showing increased volatility ($VIX) as that key benchmark index closed beneath its 20 day EMA on consecutive sessions for the first time since late June. Making matters worse is the fact that there's a negative divergence in play, suggesting that upside momentum was waning. While the stock market can move in any direction it wants at any time, I believe the odds are growing now that we'll see more short-term weakness to coincide with the historically weak August-September period. To avoid this, the bulls must first make a decisive move back above the 20 day EMA, which now appears to be rolling over and declining. Check out the combination of the S&P 500 and the VIX:
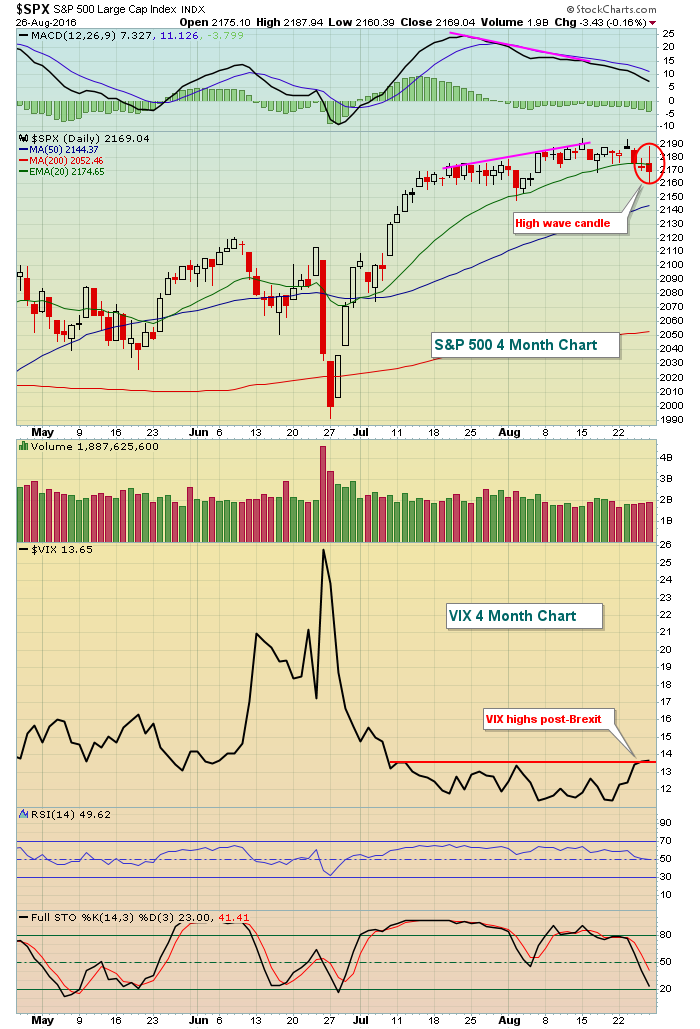 The indecision is clearly reflected by Friday's high wave candle. And it's occurring at a major technical price point. The fact that there's indecision is a sign that the bulls are losing control of the action. Unless we see a sudden reversal to the upside, I'd be expect to see more short-term consolidation, possibly selling.
Sector/Industry Watch
The Dow Jones U.S. Platinum & Precious Metals Index ($DJUSPT) is at a pivotal area as it failed at its now declining 20 day EMA on Friday, but currently holding onto key price support. Check out the technical battle that's taking shape:
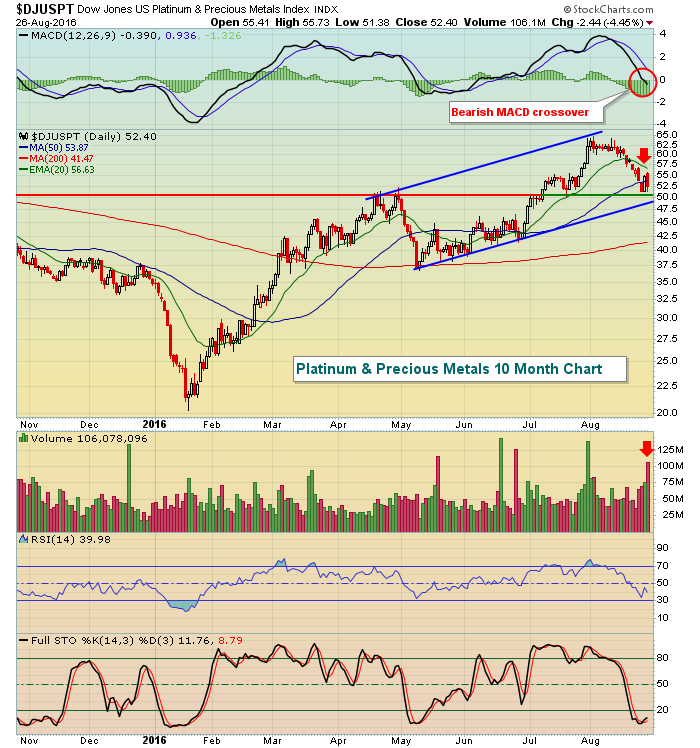 Momentum here has turned bearish, but price and trendline support have not been lost. A break below 49 would be a big technical issue for precious metals.
Monday Setup
Every Monday, I provide one stock setup here and provide a couple more in my Trading Places LIVE webinar so be sure to tune in to that webinar if you'd like to see technical setups for possible trades.
 For more information on the above chart, including possible entry points, check out my webinar later today. The link is in the Historical Tendencies section just below.
Historical Tendencies
There are only 11 industry groups that have produced average September gains of 1% or more. The two leading groups? Footwear ($DJUSFT) and internet ($DJUSNS) as they've posted average monthly gains of 4.3% and 4.2%, respectively.
I'll be discussing the two industry groups to avoid (they've each averaged September losses of more than 6%!) during my Trading Places LIVE webinar that starts at 1pm EST today. You can CLICK HERE to register for my webinar.
I am including a seasonality hand out to all those that attend next month's ChartCon event at no charge. It will include the best and worst performing industry groups by calendar month. So if you've wondered the best time to own oil stocks or technology stocks, please make sure you register for ChartCon. I'll be speaking along with many great technical analysis experts here at StockCharts.com. You'll find an information page and a link to REGISTER HERE.
Key Earnings Reports
None
Key Economic Reports
July personal income released at 8:30am EST: +0.4% (actual) vs. +0.4% (estimate)
July personal spending released at 8:30am EST: +0.3% (actual) vs. +0.3% (estimate)
Happy trading!
Tom


