Market Recap for Wednesday, August 24, 2016
Healthcare (XLV, -1.57%) was one of two sectors losing more than 1% on Wednesday as the Dow Jones U.S. Biotechnology Index ($DJUSBT) fell 2.46%. There were many losers in the biotech space, but Amgen's loss of its rising 20 day EMA with a negative divergence is simply typical of what the overall market has been facing throughout much of the summer. First, look at the DJUSBT, then AMGN:
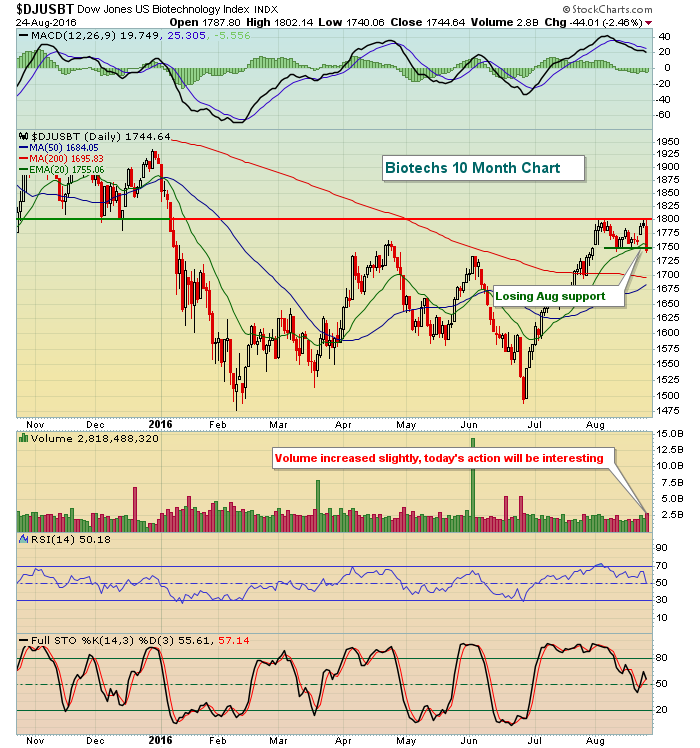 The DJUSBT was at its August high intraday yesterday, but failed at 1800 and turned lower. By the time the day had ended, the DJUSBT closed at its August low! And now here's AMGN, one of the reasons for the decline:
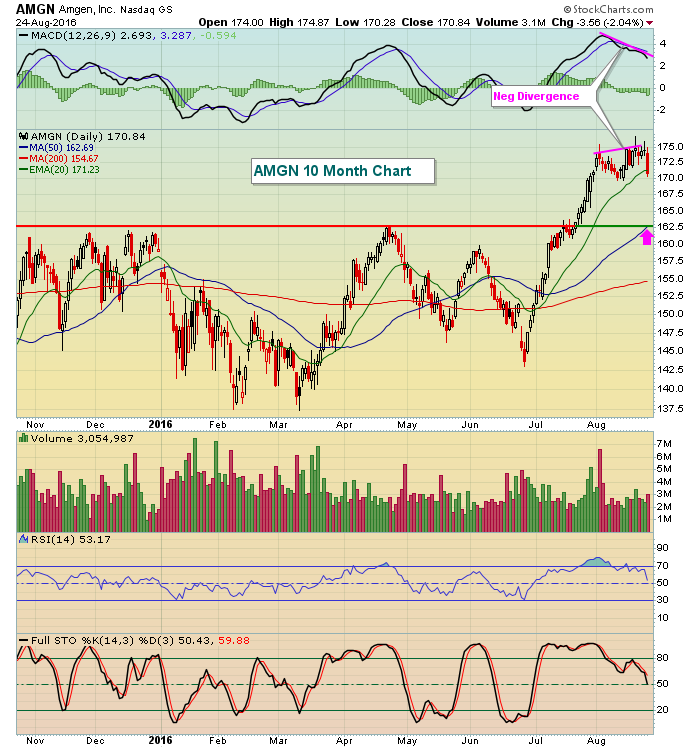 So many indices have been facing or are facing negative divergences on their daily charts. The pink arrow above shows the 50 day SMA almost squarely on price support. It looks to me like AMGN is poised for another 4-5% drop. We'll see.
Materials (XLB, -1.16%) were also weak on Wednesday as a bit of strength in the U.S. dollar likely contributed to the decline. Mining ($DJUSPM) failed to hold its 50 day SMA after recently printing a negative divergence (seeing a theme?). The breakdown was accompanied by heavy volume and the group is featured in the Sector/Industry Watch section below.
Financials (XLF, -0.04%) held up well on a relative basis as both life insurance ($DJUSIL) and banks ($DJUSBK) ended in positive territory despite the selling environment.
Pre-Market Action
U.S. futures are down modestly this morning, with the action at the opening bell likely to continue the bearish action from Wednesday. It's not helping that key global indices were down in Asia overnight and in Europe this morning. The German DAX is perhaps the most notable in terms of losses as that key index is down more than 1% this morning. There's a good chance that further weakness there will add to losses here on the S&P 500.
One stock to watch today could be Netflix (NFLX), which was upgraded at William Blair this morning. NFLX shares are at trendline resistance and a high volume breakout could trigger more upside. Check it out:
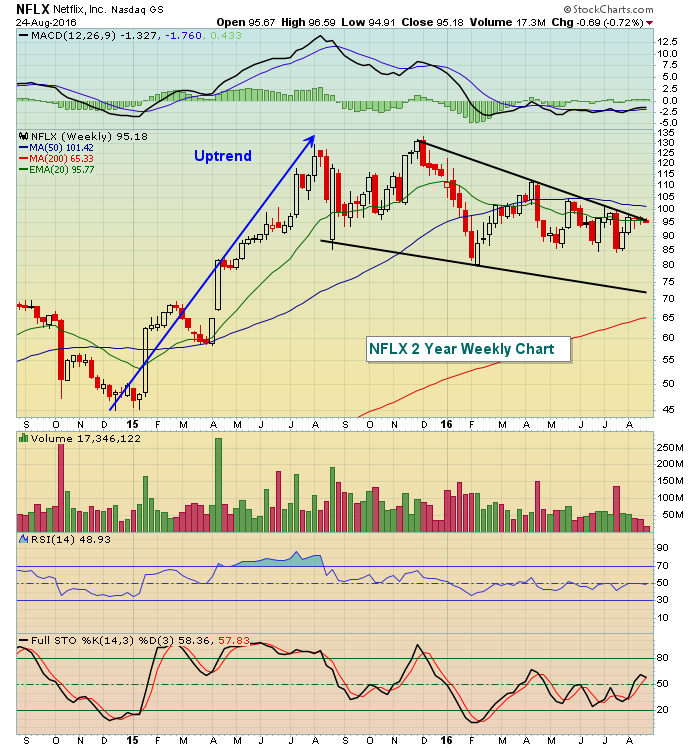 A breakout of this bullish wedge could signal the start of the next longer-term uptrend in NFLX.
Current Outlook
Volatility ($VIX) increased substantially with Wednesday's selling and that's important because big selloffs don't occur unless the VIX is trending higher and breaking above key resistance levels. Check out the current chart on the VIX:
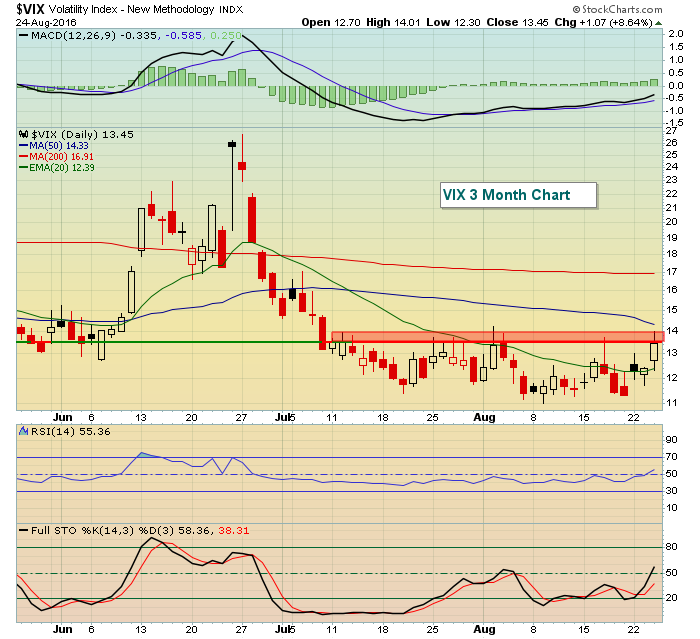 The red shaded zone above has represented a series of failures for the bears since the second week of July. We closed yesterday at resistance and with futures pointing to a lower open this morning, the bears will get another chance. The initial push in the VIX is likely to be into the 14s, but the more important question will be how we finish. Do we leave another tail to the top side with a finish back beneath 13.50? If so, there's a decent chance that the S&P 500 has once again avoided major selling and the short-term outlook would improve considerably. But given all the negative divergences and the key breakdown in biotechs on Wednesday, I'm looking for more short-term weakness. In fact, a break below 2168 on the S&P 500 will likely trigger more selling and a test of the 2131 breakout from early July.
Sector/Industry Watch
As mentioned earlier, the Dow Jones U.S. Mining index ($DJUSPM) suffered a big technical blow on Wednesday. Check it out:
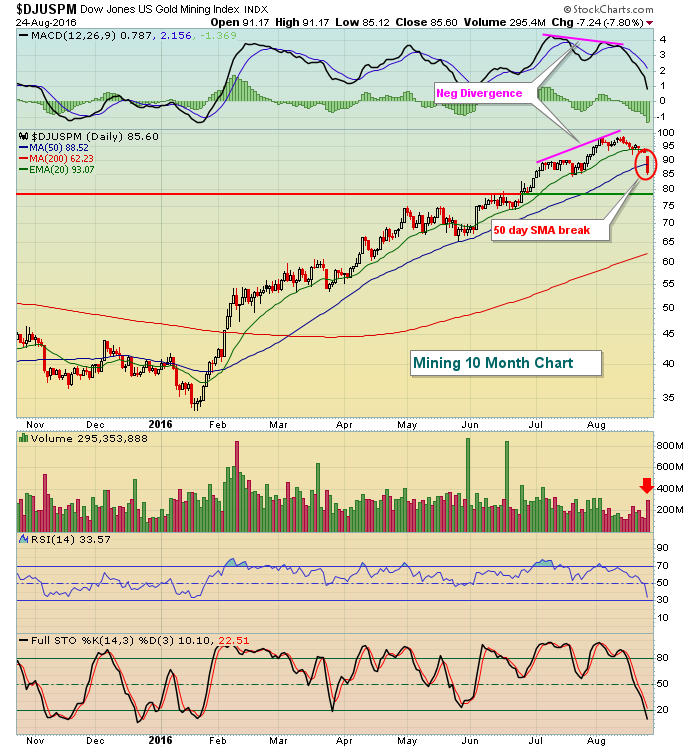 The close below the 50 day SMA represented the DJUSPM's first close there since January and the volume accelerated - a combination that should not be ignored. The next key area of support on the group will be the rising 20 WEEK EMA (not reflected above), currently near 81. The support/resistance line drawn above shows support perhaps just beneath 80, so let's call the range 79-81 if you're looking ahead to a potential bottom area.
Historical Tendencies
The 25th to the 27th of the calendar month is typically when we see seasonal bearish trends come to an end. Here are the annualized returns for these three calendar days on the S&P 500 since 1950:
25th: -8.66%
26th: +11.17%
27th: +4.24%
Keep in mind these annualized returns include all calendar days from the 25th to the 27th, not just August. Once we get past the 27th, historical action turns decidedly bullish.
Key Earnings Reports
(actual vs. estimate):
DG: 1.08 vs 1.09
DLTR: .72 vs .73
MDT: 1.03 vs 1.01
PDCO: .51 vs .51
TD: .97 vs 93
TIF: .84 vs .71
(reports after close, estimate provided):
ADSK: (.30)
BRCD: .12
GME: .26
SPLK: (.59)
ULTA: 1.39
Key Economic Reports
July durable goods released at 8:30am EST: +4.4% (actual) vs. +3.7% (estimate)
July durable goods ex-transports released at 8:30am EST: +1.5% (actual) vs. 0.5% (estimate)
Initial jobless claims released at 8:30am EST: 261,000 (actual) vs. 265,000 (estimate)
Happy trading!
Tom


