Market Recap for Thursday, September 1, 2016
Key support levels were tested - and held once again - at 2160 and 5190 on the S&P 500 and the NASDAQ, respectively. We're not going any higher, but we're not breaking down either. The S&P 500 has traded in a very narrow 30 point range for the past 6-7 weeks with both the bulls and bears hoping that today's jobs report will finally put an end to the recent boring consolidation. Consumer discretionary (XLY, +0.20%) was one of five sectors rising on Thursday, but the consolidation has been quite evident there as well. Check this out:
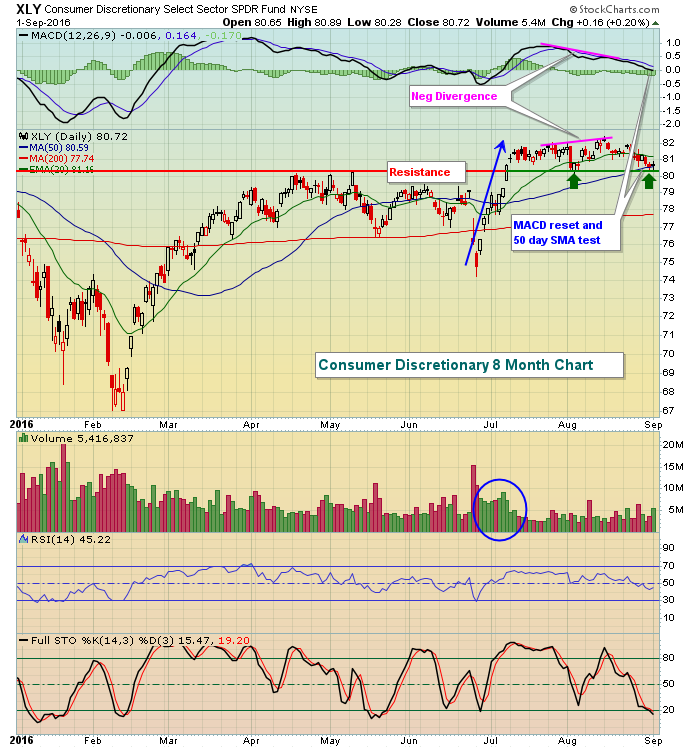 After the negative divergence printed, the XLY began a 2-3 week consolidation period that allowed the MACD to work its way back to zero while price gravitated to its 50 day SMA. This is what I refer to as a "MACD reset" that now allows momentum to potentially resume (in either direction). I typically expect the prior trend (up) to resume, especially if the longer-term weekly chart supports that as well. Take a look at the weekly XLY chart:
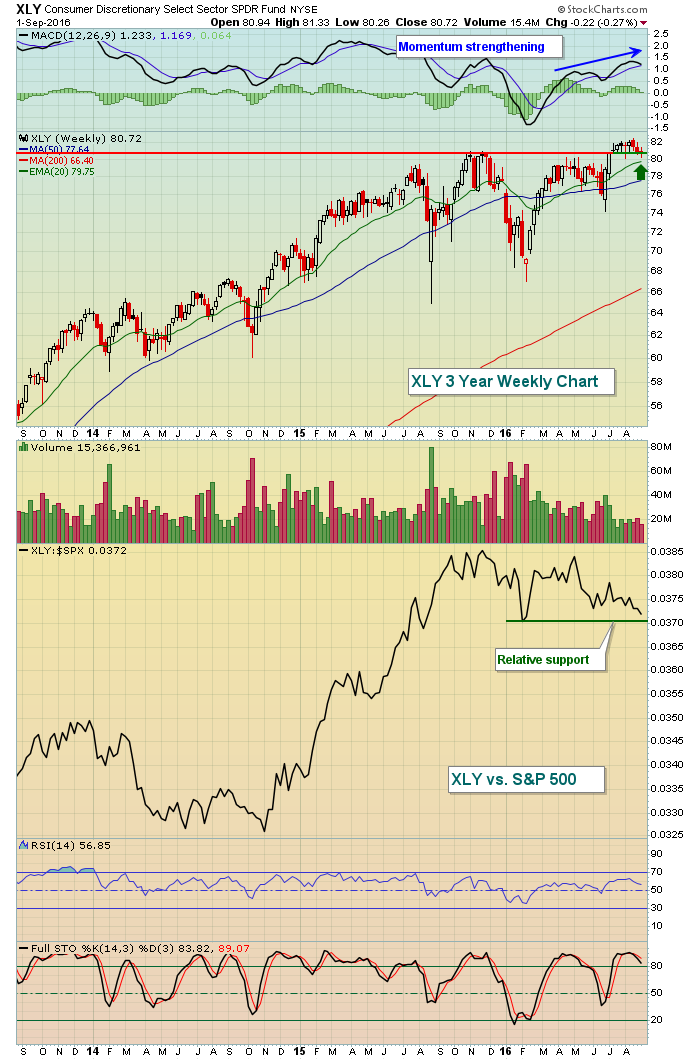 The longer-term action remains bullish. The MACD has recently printed fresh highs as the shorter-term 20 week EMA pulls away from its longer-term counterpart. The rising 20 week EMA typically holds as support when momentum is strong and the green arrow reflects that current price remains above that key moving average. Finally, relative support (XLY:$SPX) is holding thus far and that suggests we could see another round of relative strength from this sector soon.
Of the five sectors that were higher, materials (XLB, +0.41%) were the strongest as they benefited from the dollar ($USD) posting its first meaningful drop in ten trading sessions. That did little to boost energy (XLE, -0.29%), however, as the XLE closed almost squarely on its 50 day SMA. The 10 year treasury yield ($TNX) was up to 1.62% intraday on Thursday and that was enough to send utilities (XLU, -0.50%) to the bottom of the sector heap, despite the TNX finishing the day basically unchanged. If the TNX surges and closes at or above its recent high, I'd look for selling in the XLU to accelerate. I've provided a potential short-term target on the XLU below in the Sector/Industry Watch section below.
Pre-Market Action
The U.S. stock market summer doldrums aren't likely to end today. August nonfarm payrolls were reported weaker than expected 30 minutes ago and that may hold the Federal Reserve at bay later this month. The initial reaction in the treasury market was exactly as expected - initial buying with corresponding yields falling. However, selling of treasuries quickly returned and the recent uptrend in the TNX still remains intact.
Global markets are mostly higher and U.S. futures rose after the lower than expected jobs report. It likely extends the period of a very accommodative Fed and traders like that. Should the TNX turn lower later and break their month-long uptrend, banks ($DJUSBK) could be among the short-term casualties so keep an eye on that group.
Current Outlook
For CNBC, the only thing that matters is whether the Dow Jones and S&P 500 are rising or not. Sure, that's important as it has obvious connections to the value of our portfolios. But the bigger question, in my opinion, is....are the gains or losses sustainable? If equities break out, but they don't hold, chasing such a rally becomes quite costly. Therefore, it's important to evaluate what groups lead market rallies to determine whether we can trust the action. Of course, there are no guarantees, I'm talking about probabilities here. The U.S. stock market does not usually top this time of the year. But our last bear market began in October 2007. There were plenty of signs of that top and price breakdown confirmed them. Let's take a quick walk down memory lane to look at one major warning sign:
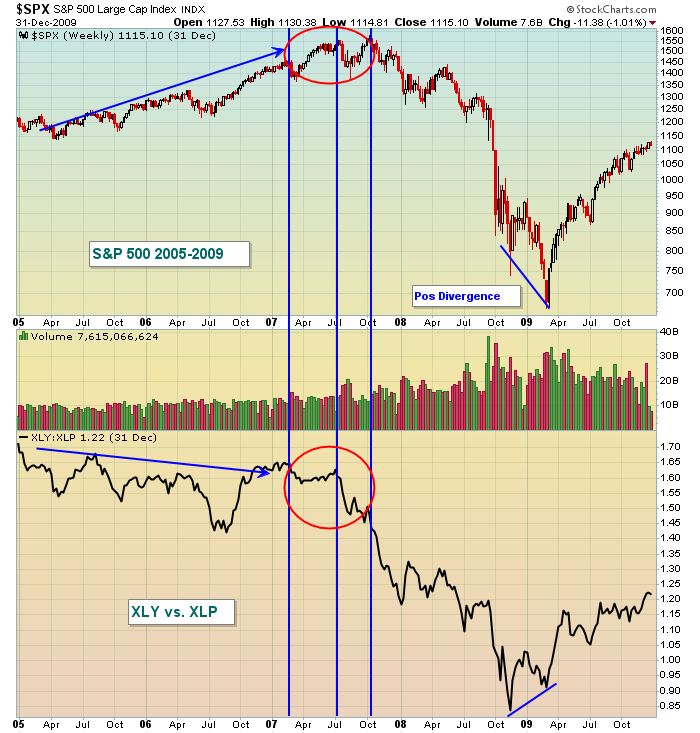 In 2005 and 2006, money had already begun rotating slightly away from the XLY (discretionary) and toward the XLP (staples). That doesn't happen when economic activity is strong or expected to strengthen so it's important to always pay attention to this ratio. But note what happened in the red circles. The S&P 500 made its final two highs as the "below the surface" XLY:XLP ratio weakened considerably. Money was rotating toward safety. When the S&P 500 finally lost its 1400-1450 support, prices collapsed the rest was history. The direction of the S&P 500 and the XLY:XLP ratio moved hand in hand......until the bear market ended. Note the positive divergence as the final S&P 500 low was actually accompanied by money rotating toward the more aggressive discretionary sector. That marked the bottom. Now let's fast forward to this same chart seven years later:
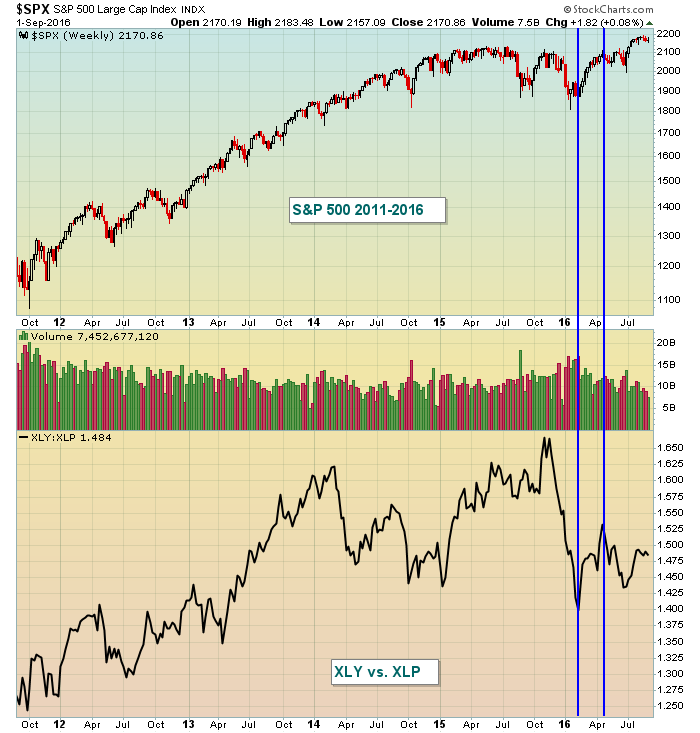 First let me say I'm drawing no conclusions from this. Rather, I'm simply aware that the most recent push higher in the S&P 500 to all-time highs is being accompanied with bearish rotation toward staples stocks. If you look back to 2014, you'll see the same thing happened and the S&P 500 continued its march into record territory. So one signal alone cannot be acted upon. But also realize that money rotated bearishly for two years prior to the last bear market so it's worth noting what is taking place beneath the surface of the market in the event we witness a serious price breakdown. As a result, I am maintaining a "cautiously bullish" approach to U.S. equities. Nothing is more important that the combination of price and volume. On a longer-term weekly chart, the recent breakout to all-time highs is accompanied by strengthening weekly MACDs. Stay long.....for now.
Sector/Industry Watch
Utilities (XLU) remain under pressure with 10 year treasury yields on the rise. Let's see where the TNX finishes today, but if it's higher, then the recent downtrend in the XLU could carry it down to perhaps 46 before more significant buying kicks in. Take a look:
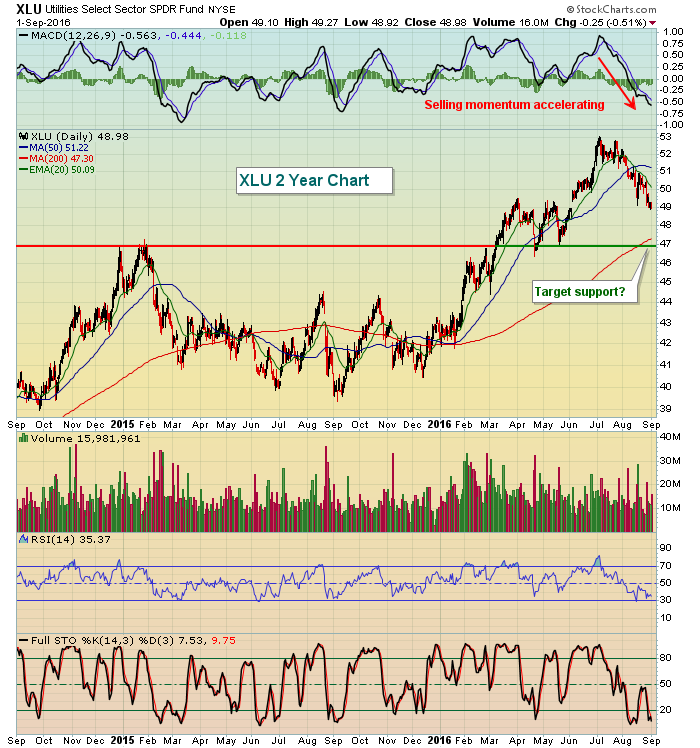 The downside target seems to be near 47 as that's where both price support and the rising 200 day SMA reside. To the upside, continue to watch the declining 20 day EMA. We've seen a death cross (20 day falling below 50 day) and every rally attempt in August failed at the 20 day EMA. So until we see a close above, I'd view rallies rather suspiciously.
Historical Tendencies
For what it's worth, September 2nd is one of the strongest days of the month on the NASDAQ (since 1971). September 2nd has produced an annualized return of 84.39%, likely benefiting from positive money flow early in the month.
Key Earnings Reports
None
Key Economic Reports
August nonfarm payrolls released at 8:30am EST: 151,000 (actual) vs. 175,000 (estimate)
August nonfarm private payrolls released at 8:30am EST: 126,000 (actual) vs. 179,000 (estimate)
August unemployment rate released at 8:30am EST: 4.9% (actual) vs. 4.8% (estimate)
August average hourly earnings released at 8:30am EST: +0.1% (actual) vs. +0.2% (estimate)
July factory orders to be released at 10:00am EST: +2.0% (estimate)
Happy trading!
Tom


