Market Recap for Tuesday, October 25, 2016
If you own consumer discretionary (XLY, -1.17%) stocks, you probably weren't too happy with your performance on Tuesday. 22 of 23 industry groups within the discretionary sector fell with only travel & tourism ($DJUSTT) escaping the bears' wrath. Media agencies ($DJUSAV) were hit the hardest with Nielsen (NLSN) plummeting 17% after its quarterly earnings report came up short of expectations. Holding stocks into their earnings reports is a very risky proposition and NLSN is simply one example of that. Heading into earnings, NLSN didn't look particularly bad from a technical perspective. Check it out:
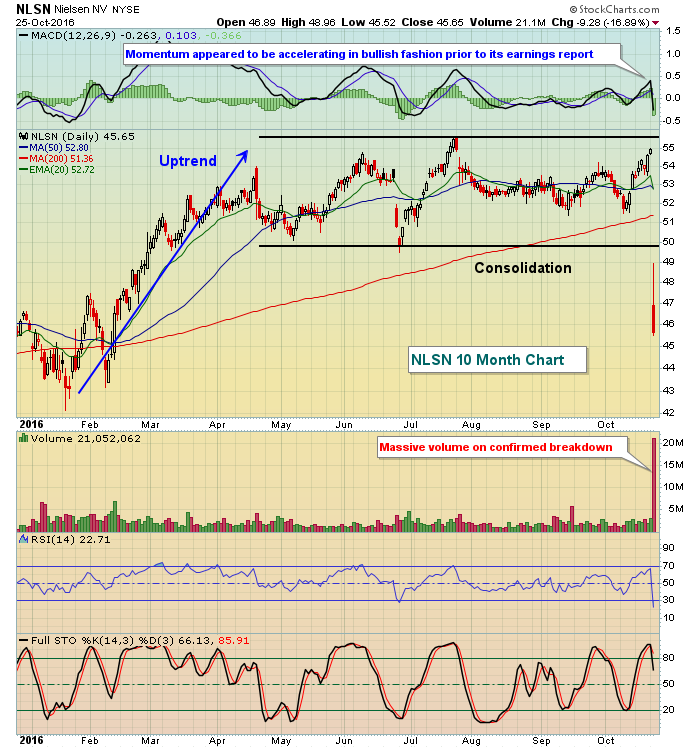 If I had been forced to trade NLSN prior to its earnings, I'd have been long based on the technical indications. But I'm a believer that you can toss technical analysis when it comes to big earnings news. The surprises can be either positive or negative, but it always seems that I'm on the wrong side. So my preference is to simply let others take the risk of holding into earnings and I'll wait for better reward to risk entry points down the road.
Media agencies weren't the only problem within discretionary. Four other industry groups lost more than 3%, including home improvement retailers ($DJUSHI). Home Depot (HD) and Lowes (LOW) both broke down again and did so on increasing volume - very bearish action. Furthermore, HD lost significant price support in the process. Take a look:
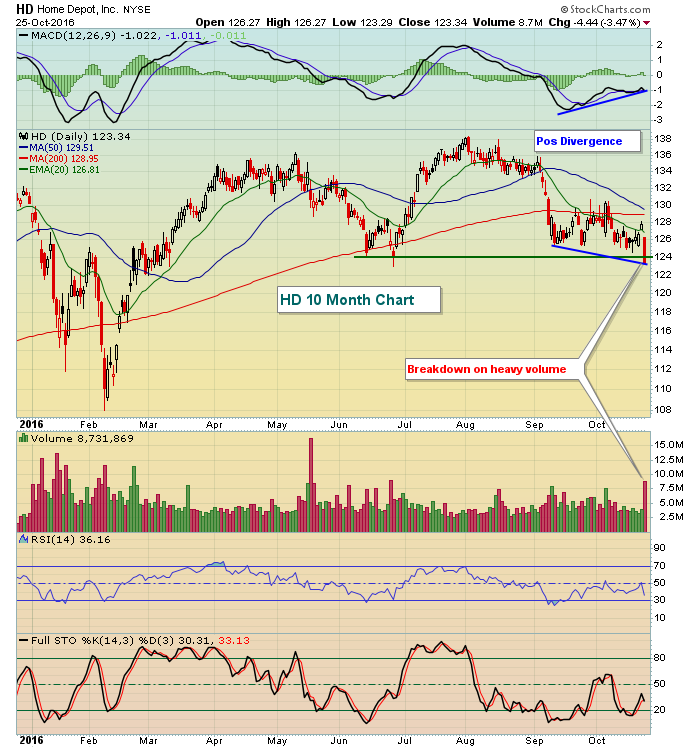 Home Depot closed beneath 124 price support for the first time since early March. The MACD shows a positive divergence, which is an indication of slowing selling momentum. But keep in mind that the MACD does not take into account volume. I find it very difficult to embrace the "slowing momentum" theory when a stock breaks to fresh lows on its heaviest volume in five months. Is momentum truly slowing? This is an example why the combination of price and volume is so important in technical analysis.
Our major indices were down fractionally on the session Tuesday, but leadership emerged from defensive groups. Utilities (XLU, +0.62%) and consumer staples (XLP, +0.36%) were the only two groups that finished in positive territory yesterday.
Pre-Market Action
Global profit taking, crude oil ($WTIC) back below $50 per barrel and an underwhelming earnings report from behemoth Apple Inc (AAPL) all have U.S. futures under pressure. At last check, Dow Jones futures are down 61 points, adding to the weakness from Tuesday. As a reminder, we are in a very bearish historical period that lasts through tomorrow's close. The key will be the S&P 500 holding 2120 price support on any further selling.
AAPL's report wasn't bad as its revenues and EPS came in slightly ahead of consensus estimates and CEO Tim Cook promises that AAPL is returning to solid growth, but the stock is nonetheless under a bit of selling pressure in pre-market trading. Technically, there's a slight negative divergence on the AAPL chart so a trip back to test rising 50 day SMA support near 112 shouldn't be ruled out. Price support also resides in that general neighborhood - at 110.83.
Current Outlook
We remain in a very bearish historical week of the year and it ends at tomorrow's close. The Volatility Index ($VIX) spiked 3.38% on Tuesday and, with U.S. futures under pressure this morning, it will be interesting to see if the short-term rising trend in the VIX continues as a more bullish historical period (October 28th through November 6th) approaches. I'm not concerned about the VIX currently, but it always bears watching. The level of fear and nervousness is tracked using the VIX as it is calculated based on the premiums of short-term S&P options. As the option premiums grow, the market's expected volatility rises and a high VIX environment is the backdrop for a thriving bear market. Based on historical norms, the current VIX level is quite low and accompanies bull markets. But once the VIX breaks above the 16-17 level, you definitely want to watch its behavior daily. Here's the current state of the VIX:
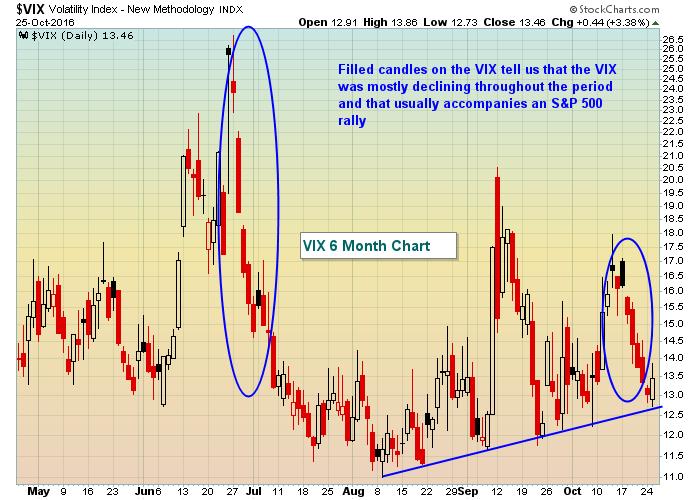 The good news for the bulls is that the recent two week downtrend in the VIX (right blue circle) enabled the bulls to defend price support on the S&P 500 at 2120. The bad news, however, is that the past couple months show a rising trend in the VIX (up sloping blue line). Therefore, it's fairly obvious that market participants are growing a bit more nervous as the period of price consolidation between 2120-2190 on the S&P 500 continues. A breakout in the VIX above 16-17 and a breakdown in the S&P 500 beneath 2120 - the combination of both - should be respected and your trading strategy should be re-evaluated. Until then, however, I'll remain cautiously bullish.
Sector/Industry Watch
Discretionary spending is a big part of our economy and the discretionary sector (XLY) is one of our four aggressive sectors. It's a sector that I always watch for market clues. It appeared to have broken a recent short-term downtrend line with a solid day on Monday. That, however, changed with yesterday's big red candle and XLY's drop greater than 1% to lead the market lower. The chart is okay technically, though, and will remain so as long it trades between 77.75-80.25. Here's the visual:
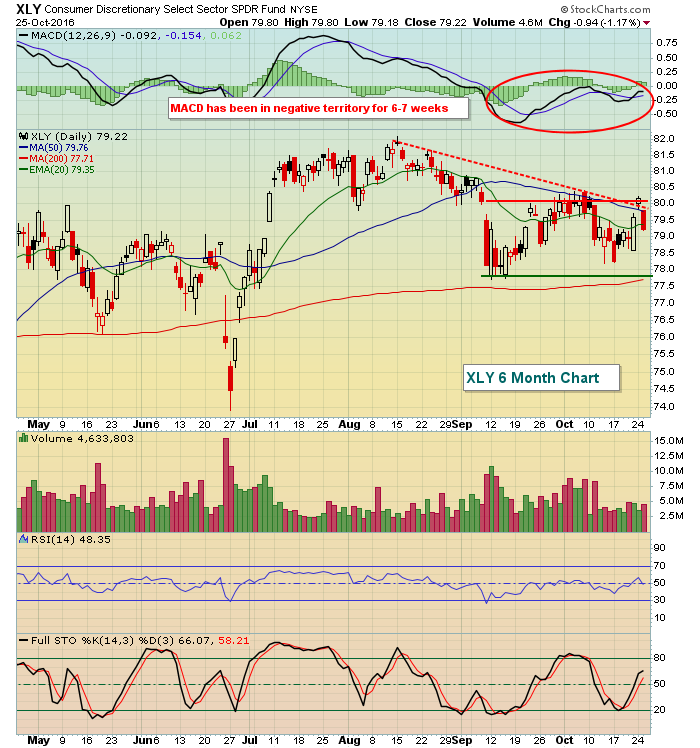 The daily MACD has been below its centerline for most of the past two months. This simply states that the short-term 12 day EMA has been below the longer-term 26 day EMA. An uptrend requires the opposite. So a bullish technical signal would be a breakout above 80.25 on the XLY with an accompanying bullish MACD centerline crossover.
Historical Tendencies
I've been discussing the bearish historical tendencies on the various major indices. That historical bearishness will abruptly come to an end as of Thursday's close and pave the way for EXTREMELY bullish tendencies to close out October and begin November. For instance, check out the annualized returns for this upcoming period on the NASDAQ since 1971:
October 28th (Friday): +181.75%
October 31st (Monday): +102.40%
November 1st (Tuesday): +25.05%
November 2nd (Wednesday): +148.44%
November 3rd (Thursday): +97.60%
November 4th (Friday): +75.50%
Those are difficult numbers to ignore. This bullish period also coincides with the stock market's general tendency to close out old months and open new months with bullish behavior as positive money flows drive prices higher.
Key Earnings Reports
(actual vs. estimate):
BA: 3.51 vs 2.62
BAYRY: 1.93 vs 1.80
BIIB: 5.19 vs 4.97
BSX: .27 vs .27
CMCSA: .92 vs 92
GD: 2.48 vs 2.37
GRMN: .75 vs .53
HES: (1.12) vs (1.25)
HLT: .23 vs .23
IR: 1.41 vs 1.29
KO: 1.49 vs 1.48
LH: 2.25 vs 2.29
LUV: .93 vs .88
MDLZ: vs .43 (haven't seen actual yet)
NOC: 3.02 vs 2.81
NSC: 1.55 vs 1.45
SPG: vs 2.68 (haven't seen actual yet)
STT: 1.35 vs 1.25
WM: .84 vs .80
WYN: 1.89 vs 1.87
(reports after close, estimate provided):
ABX: .19
AEM: .20
BA: 3.51
EFX: 1.36
FBHS: .78
FFIV: 1.54
FISV: 1.13
NEM: .52
NXPI: 1.37
ORLY: 2.92
PSA: 2.51
SU: (.08)
TSLA: (.64)
TXN: .86
UNM: .95
VMW: .80
WDC: 1.05
Key Economic Reports
September new home sales to be released at 10:00am EST: 601,000 (estimate)
Happy trading!
Tom


