Market Recap for Monday, October 17, 2016
The benchmark S&P 500 flirted with key short-term price support at 2120 once again, this time finishing at 2126 as consumer discretionary (XLY, -0.82%) was the weakest sector and also approached key price support. Consumer discretionary is an important sector to keep an eye on as it houses companies that sell products that we want, not what we need. Discretionary spending helps us to determine our economic prospects. When the economy is improving or expected to improve, this group should perform well on an absolute basis and also on a relative basis vs. consumer staples (XLP, -0.48%) companies. Check out where both stand:
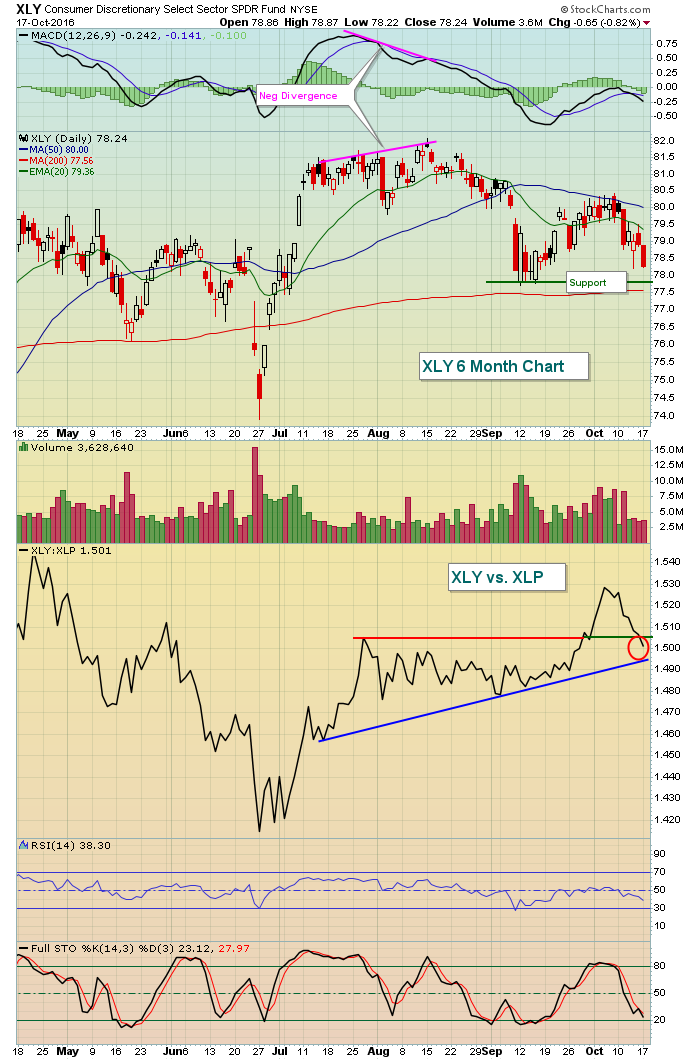 The XLY performed extremely well coming off that Brexit-related low in late June. But after that initial move higher, a negative divergence developed and prices since then have been on the decline. Despite the move lower in September, the XLY held up quite well vs. the XLP, a positive sign for equities as traders continued to seek out risk vs. safety. But thus far in October, we've seen absolute weakness in the XLY, in addition to relative weakness. The short-term price support at 77.80 is rather obvious, but there's also relative support that needs to be monitored as well. Should the S&P 500 break beneath 2120 and this relative ratio (XLY:XLP) breaks beneath 1.49, we could see the U.S. equity market grow much more nervous and conservative, potentially sending our benchmark index much lower.
Pre-Market Action
U.S. futures are quite strong this morning despite a miss by IBM after the bell on Monday. IBM is down 3% in pre-market action. Netflix (NFLX), on the other hand, reported very strong quarterly results and shareholders are waking up to an 18% pop this morning. Goldman Sachs (GS) also provided an earnings beat and a lift for equities in early action.
Global markets set the stage as most markets in Asia and Europe are higher today, with crude oil ($WTIC) also moving to the upside.
Current Outlook
The Russell 2000 has outperformed the S&P 500 throughout 2016 and that's been one of the strongest bullish signals as far as I'm concerned. Recently, however, we've seen some underperformance. For example, the Russell 2000 hit its low from last Thursday yesterday while all of the other major indices remained well above their respective Thursday lows. The good news for the Russell 2000 is that its weakness has resulted in a positive divergence forming on its hourly chart. Check it out:
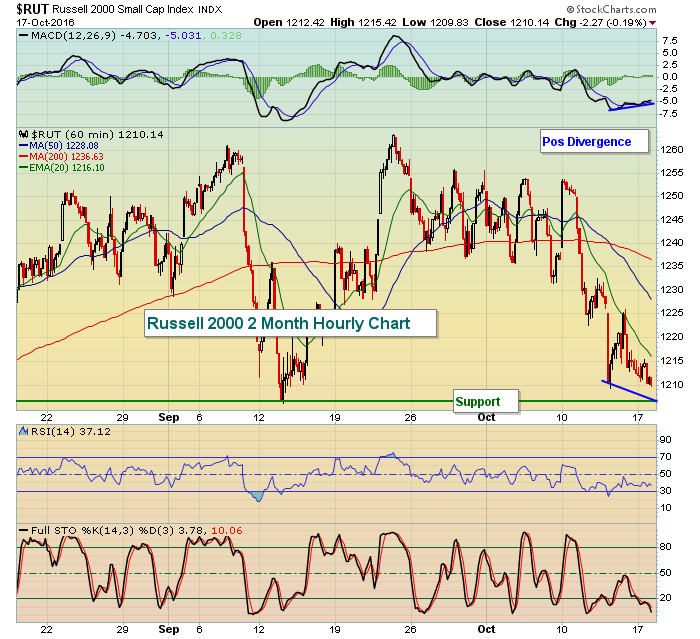 There's already a slight positive divergence on this chart as the Russell 2000 approaches its two month low (price support). Therefore, the reward to risk appears to be strongest on this index at the moment as you can keep a tight stop and potentially benefit from the unwinding of slowing selling momentum.
Sector/Industry Watch
Over the past three months, the S&P 500 is down approximately 2% but areas of consumer staples have been trounced. Tires ($DJUSTR) and brewers ($DJUSDB) have escaped the carnage and have been the only two industry groups moving notably higher within the sector. The worst performer, food retailers and wholesalers ($DJUSFD) could be on the verge of bottoming after posting losses of nearly 12% since mid-July. Take a look at the positive divergence that's formed:
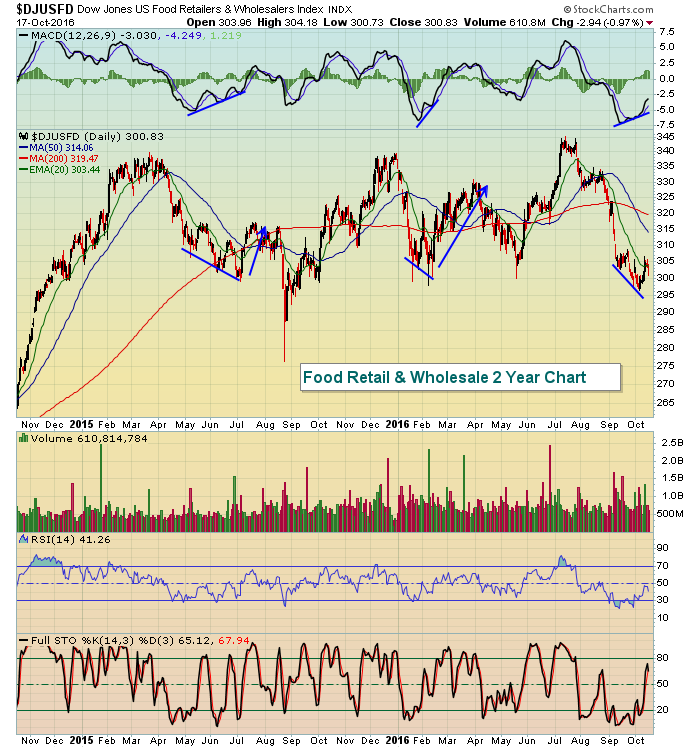 This is the third time we've seen positive divergences form on the DJUSFD chart and both previous occasions resulted in short- to intermediate-term strength. Should the overall indices move higher from here, we could see renewed strength from food retailers to help lead the market higher. 2016 has been a year of rotation and it could be time for the DJUSFD to regain strength. Note that the recent lows are very close to where we saw lows over the past two years, with August 2015 being the lone exception.
Historical Tendencies
This may seem odd, but home construction ($DJUSHB) performs best from October through January and it is literally sitting right on significant price support. Therefore the reward to risk within this space would seem to make a lot of sense. Check out the chart:
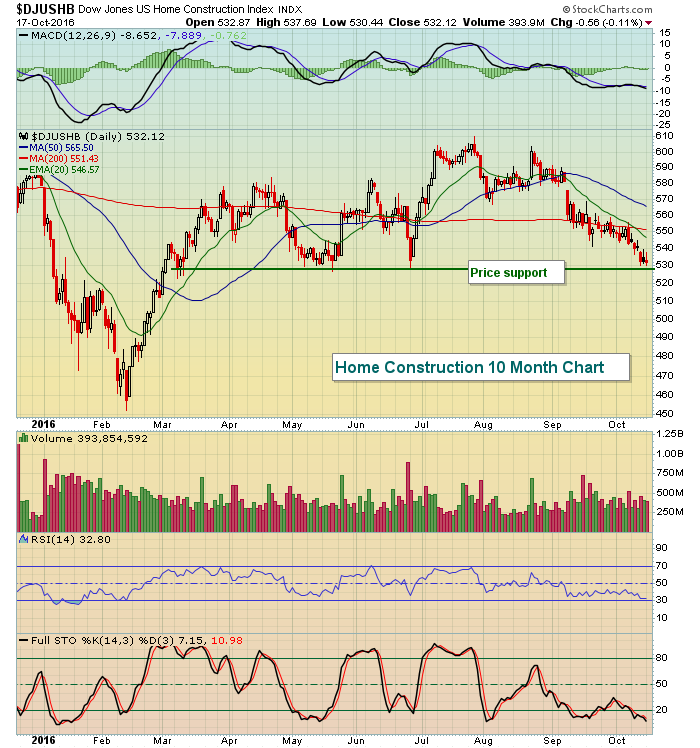 RSI is nearing an overbought 30 level and stochastic is at 7. A short-term bounce certainly shouldn't be ruled out with the potential for much more than a bounce in play.
Key Earnings Reports
(actual vs. estimate):
BLK: 5.14 vs 5.05
CMA: .92 vs .79
DPZ: .96 vs .90
GS: 4.88 vs 3.86
GWW: 3.06 vs 3.02
HOG: .64 vs .63
JNJ: 1.68 vs 1.65
OMC: 1.06 vs 1.03
PM: 1.25 vs 1.23
RF: .24 vs .21
SCHW: .34 vs .33
UNH: 2.17 vs 2.08
(reports after close, estimate provided):
INTC: .73
ISRG: 4.35
YHOO: .05
Key Economic Reports
September CPI released at 8:30am EST: +0.3% (actual) vs. +0.3% (estimate)
September Core CPI released at 8:30am EST: +0.1% (actual) vs. +0.2% (estimate)
October housing market index to be released at 10:00am EST: 63 (estimate)
Happy trading!
Tom


