Market Recap for Wednesday, October 5, 2016
Well, the market rotation continues unabated. It was bounce back day on Wednesday, although no key levels of price resistance were cleared. Volume did accelerate, however, as a shorter-term triangle unfolds on the S&P 500. You can check out the recent short-term action on this chart:
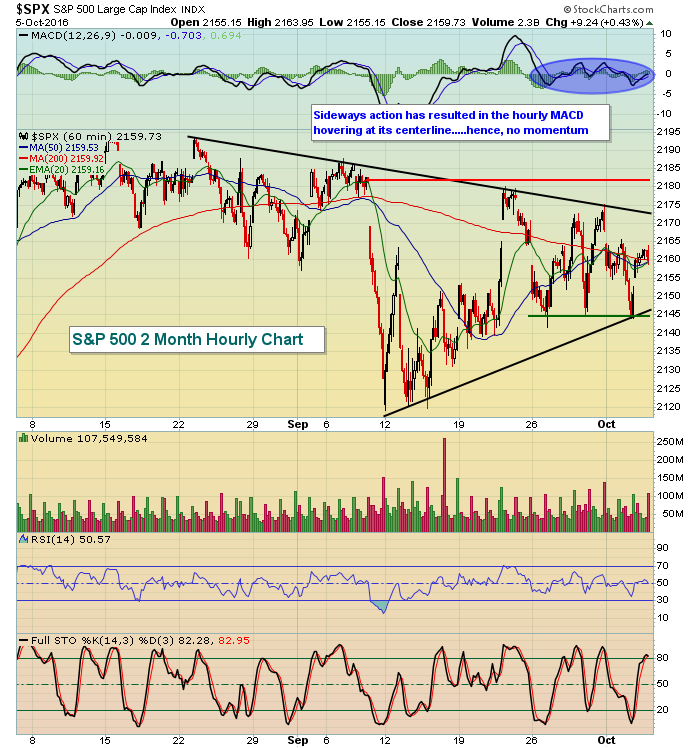 Yesterday's rally occurred as the S&P 500 was testing recent price support (green horizontal line). But note how the highs continue declining while the lows rise. This is the hallmark of a squeezing triangle pattern. A break could result in a powerful move in one direction or the other so keep an eye on the pattern.
Financials (XLF, +1.61%) and energy (XLE, +1.53%) were the primary leaders during Wednesday's rally as the next best sector was materials (XLB, +0.68%). The leading industry group in financials was life insurance ($DJUSIL) as that group made a definitive breakout and is featured below in the Sector/Industry Watch section. Two defensive sectors - utilities (XLU, -0.21%) and consumer staples (XLP, -0.10%) - did not participate in the rally as traders again shunned defensive areas of the market. If certain areas are going to be lower, you want them to be defensive areas, but my preference is always to see a broad market advance to include both offensive and defensive areas.
Pre-Market Action
While China's Shanghai Composite ($SSEC) remained closed for its Golden Week holiday, both the Nikkei ($NIKK) and Hang Seng ($HSI) tacked on gains overnight. European indices are mostly trading near their flat lines and U.S. futures are showing very minor losses as we await the opening bell.
Crude oil prices ($WTIC) have moved back above $50 per barrel and that should create further tailwinds for energy shares. Energy has been the sector leader over the past week, month and six months and that won't likely change if crude oil can clear key resistance near $52 per barrel. The measurement of that breakout would be in the low $70s per barrel, which would be a boon to energy stocks.
Current Outlook
The selling of treasuries is helping to fuel the rise in many interest-sensitive areas of the market like banks ($DJUSBK), life insurance ($DJUSIL) and investment services ($DJUSSB) - all aggressive areas within the more docile financial space. The Fed is talking tough about further rate hikes, although it's not likely to happen prior to the November election here in the U.S. Still, the treasury market seems to be taking notice as the 10 year treasury yield ($TNX) has been on the rise and is now approaching a major short-term yield resistance level. Take a look:
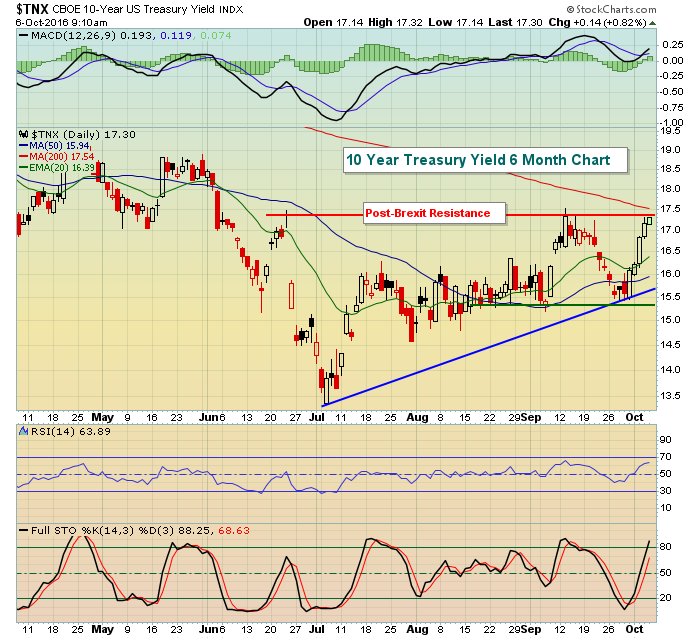 In early action this morning, treasuries are once again under pressure with the yield rising slightly to sit on that key 1.74% resistance. A break above 1.74% would likely lead to a quick test of 1.90%, although I suspect we'd see 1.98%-2.00% rather quickly. That selling in treasuries would help industries like banks and insurers so don't be surprised if these groups are among the 4th quarter leaders on a relative basis.
Sector/Industry Watch
Rising treasury yields are certainly impacting the Dow Jones U.S. Life Insurance index ($DJUSIL) in a positive way. Below is a current chart of the DJUSIL, highlighting its breakout on Wednesday, along with its positive correlation to the 10 year treasury yield ($TNX):
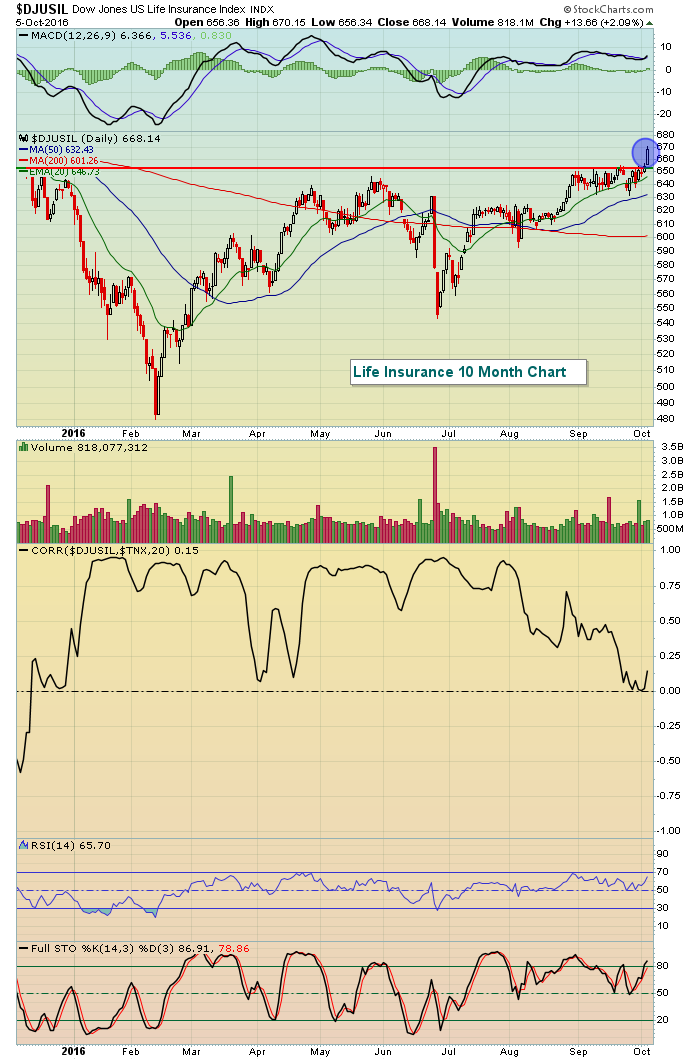 The DJUSIL has a very strong long-term positive correlation with the TNX on its 10 year weekly chart (not shown above). If you look in the Current Outlook section above, you'll see a chart of the TNX. It is currently threatening a breakout above 1.74%, which has been its highest level for the past few months. A breakout above 1.74% is likely to send the DJUSIL much higher so if you're unsure how to play higher treasury yields, this would be one industry group to key in on. Banks ($DJUSBK) are another industry group that benefits from higher yields and the DJUSBK rose 1.99% yesterday.
Historical Tendencies
Wednesdays, Thursdays and Fridays have been strong calendar days for NASDAQ stocks since 1971 as they all have produced annualized returns of 20% or more. They perform even better during the times of the calendar month when stocks typically rise (ie, 28th through 6th and 11th through 18th).
Key Earnings Reports
None
Key Economic Reports
Initial jobless claims released at 8:30am EST: 249,000 (actual) vs. 256,000 (estimate)
Happy trading!
Tom
