Market Recap for Wednesday, October 12, 2016
Considering the selling that began early Monday and continued all day Tuesday, Wednesday provided some relief to the bulls. The U.S. market did finish in bifurcated fashion with the Dow Jones and S&P 500 gaining fractionally while both the NASDAQ and Russell 2000 ended the day with minor losses. Still, it felt good to stem the tide of selling - even if for just a day.
Defensive areas led the action, which was a bit surprising given another day of losses in the treasury market (with the corresponding yields rising). Utilities (XLU, +0.98%) and consumer staples (XLP, +0.56%) posted the best gains. Healthcare (XLV, -0.42%) and energy (XLE, -0.37%) were weakest with the latter suffering from profit taking in crude oil ($WTIC). The drop in crude was to be expected given the recent overbought conditions. Check it out:
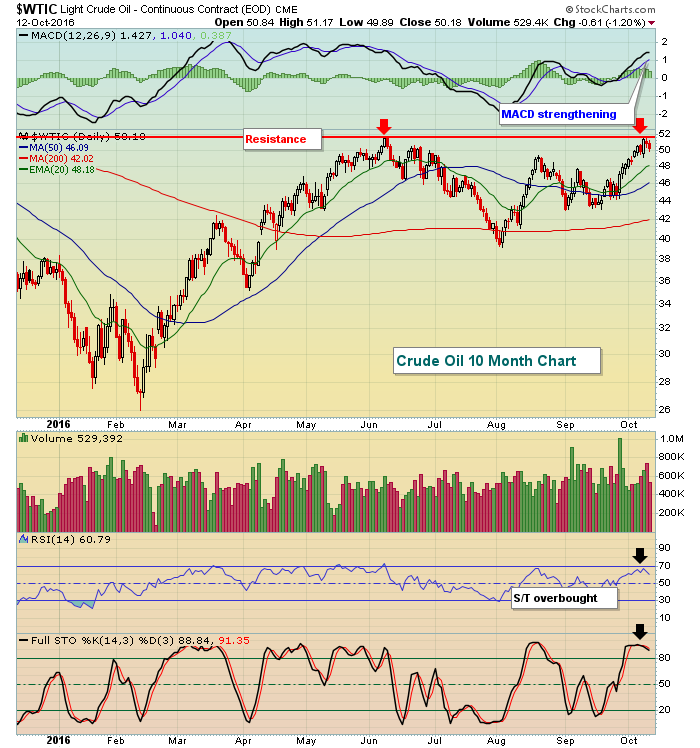 The rising 20 day EMA is close to $48 per barrel and given the strength in the MACD, which highlights very bullish short-term momentum, I'd look for that rising 20 day EMA to provide excellent support on any further profit taking.
Pre-Market Action
U.S. futures are turning ugly, continuing the bearish behavior we've seen this week. Dow Jones futures are down 112 points with just 10 minutes of pre-market action remaining. This is a follow through of weakness seen overnight in Asia and this morning in Europe. The German DAX is down close to 150 points to 10350. 10200 is a major support level in Germany. Loss of that support would likely increase the selling here in the U.S.
Current Outlook
This isn't rocket science. The S&P 500 has been bouncing between very important price support of 2120 and key price resistance of 2190 for the past three months. The long-term price picture remains very bullish, while "beneath the surface" signals paint a much more cautious picture. Given that inconsistency, short-term price support becomes quite significant. A breakdown would suggest that we pay more attention to those cautious beneath the surface signals and adjust our portfolios accordingly. Once again, here's the chart to watch:
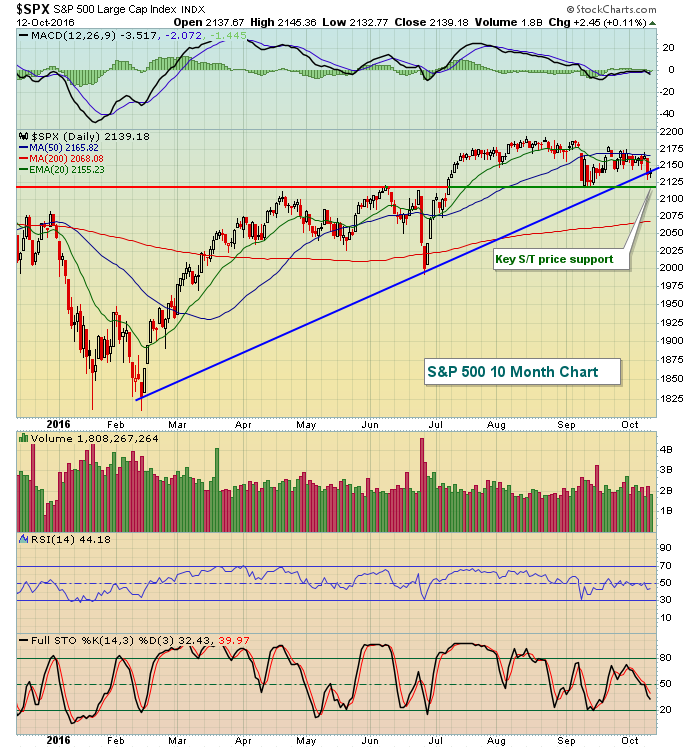 Stripped down to its basics, price support is the major technical indication. Futures are pointing to an open that could test this level very early on. What's not shown above is the weekly chart where the S&P 500 has a 20 week EMA at 2136, just below Wednesday's close. So loss of 2120 would be a major violation on the long-term weekly chart in addition to the short-term breakdown reflected above. That is a technical change that we simply cannot ignore. It doesn't mean a bear market is starting, but it certainly puts us on alert for that possibility and, as a result, my trading strategy will become much more conservative.
Sector/Industry Watch
Gambling stocks ($DJUSCA) might not be worth the risk right now. They've been in the top 5 industry groups within consumer discretionary over the past one, three, six and twelve month periods. They've been the top performer in that latter time period, rising 28.09% over the past year. But it may have run too far based on Tuesday's failed attempt at a breakout and a negative divergence on the daily chart. Here's the visual evidence:
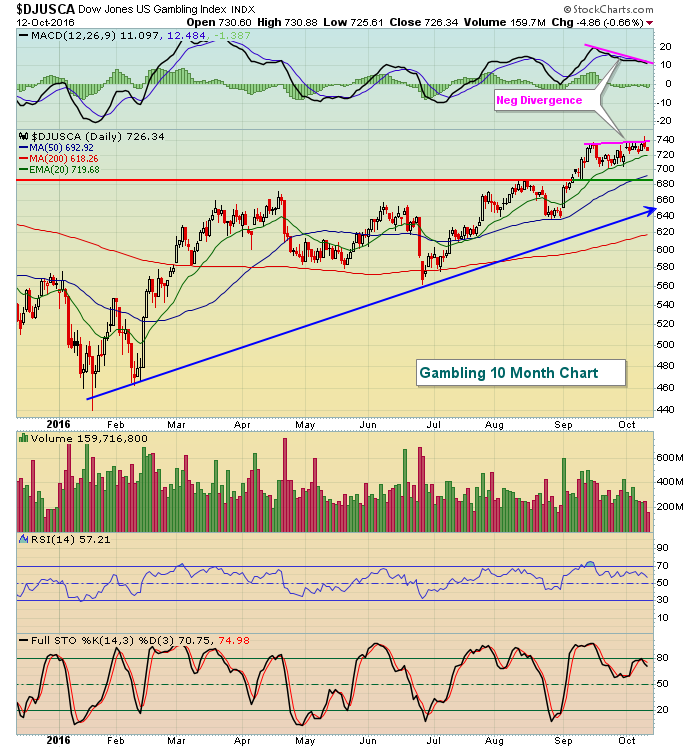 After a negative divergence forms and we see a reversing candle, my immediate expectation is that the rising 20 day EMA can no longer be relied upon in the short-term to provide support. Instead, I'd be looking for a 50 day SMA test and a potential MACD retreat to centerline support. The 50 day SMA is currently at 693 and price support is just beneath that level. Should the DJUSCA return to this area, the reward to risk entry would be much improved. Until then, patience is likely to be your best friend.
Historical Tendencies
Today is the 13th of October and for many the number 13 represents bad luck. Historically that has not been the case for October 13th as the S&P 500 has posted annualized returns of 67.09% on this date. Traders will have to dig into their historically bullish basket to turn around futures this morning, however, which are pointing to a sharply lower open.
Key Earnings Reports
(actual vs. estimate):
DAL: 1.70 vs 1.64
PGR: .36 vs .35
(reports after close, estimate provided):
INFY: .24
Key Economic Reports
Initial jobless claims released at 8:30am EST: 246,000 (actual) vs. 254,000 (estimate)
Happy trading!
Tom


