Note
I'll be out for personal reasons on Wednesday so I'll not likely be able to post a blog article Wednesday morning. Also, the Bowley Briefing webinar, scheduled for Wednesday at noon EST, has been cancelled as well. I should be back in full swing Thursday.
Market Recap for Monday, November 28, 2016
Energy (XLE, -1.39%) and financials (XLF, -1.16%) led U.S. stocks to their worst daily performance in three weeks. Crude oil prices ($WTIC) have been under pressure for the past few trading sessions after nearly touching $50 per barrel last week. Financials had been on fire since the election and with the 10 year treasury yield ($TNX) climbing. Yesterday, the TNX fell five basis points to 2.32% and that stopped many financial stocks dead in their tracks. The following chart, however, shows that both the XLE and XLF remain in favor in terms of relative performance:
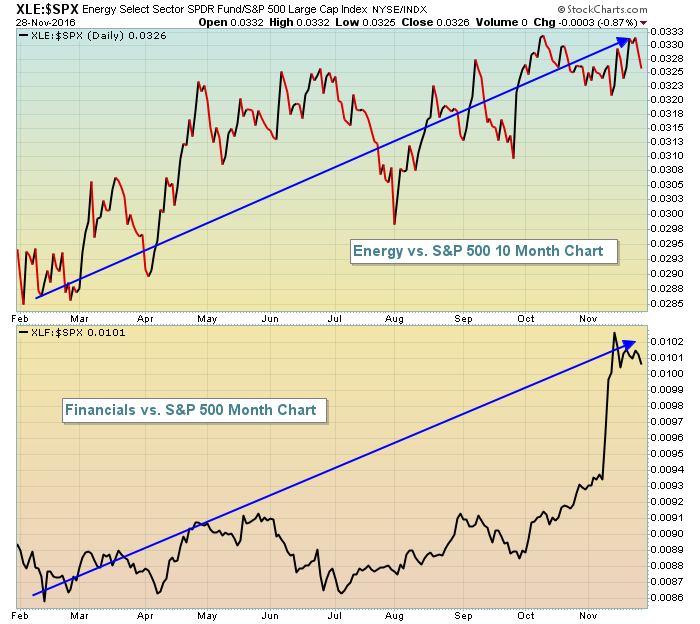 They've each taken separate routes to their respective leadership roles - the XLE has been steadily outperforming throughout most of 2016 while much of the XLF's relative strength has stemmed from the TNX bottoming during the summer. Nonetheless, based on the above chart, I wouldn't worry too much about either of these sectors based on yesterday's performance. In fact, there's room for more relative weakness in the near-term, especially with the financials.
While we witnessed profit taking throughout most areas of the market, money did rotate towards defense. Leading the charge from this change of psyche were gold mining ($DJUSPM) and mining ($DJUSMG) stocks. They gained 4.71% and 3.44%, respectively, but neither jump made a technical difference in their respective charts. The DJUSMG is featured below in the Sector/Industry Watch section.
Pre-Market Action
Asian markets were mixed overnight and European markets are mixed this morning. Here in the U.S., the 2nd estimate of the Q3 GDP was released and it came in slightly better than expected (+3.2% vs +3.1%). Dow Jones futures reflect the choppy action around the globe and are up, but only by 9 points at last check.
The market is nervous about a potential OPEC production cut as crude oil prices ($WTIC) have fallen 2.7% this morning, likely keeping pressure on the energy group today.
Tiffany (TIF) posted solid quarterly results and is up more than 5% this morning in pre-market action. Cyber Monday sales topped estimates so retailers could see a nice 1-2 punch as we open for trading.
Current Outlook
The action of late has been undeniably bullish with breakouts across all of our major indices confirmed by money rotating into aggressive areas. It simply doesn't get any better than that. The S&P 500's latest breakout also now marks a clear up channel in play after the early 2016 lows printed. The slope of this uptrend is quite steep so as long as it remains in play, we'll see sizable S&P 500 gains. By the time we move into the second quarter of 2017, the lower end of this channel is near 2200. Check it out:
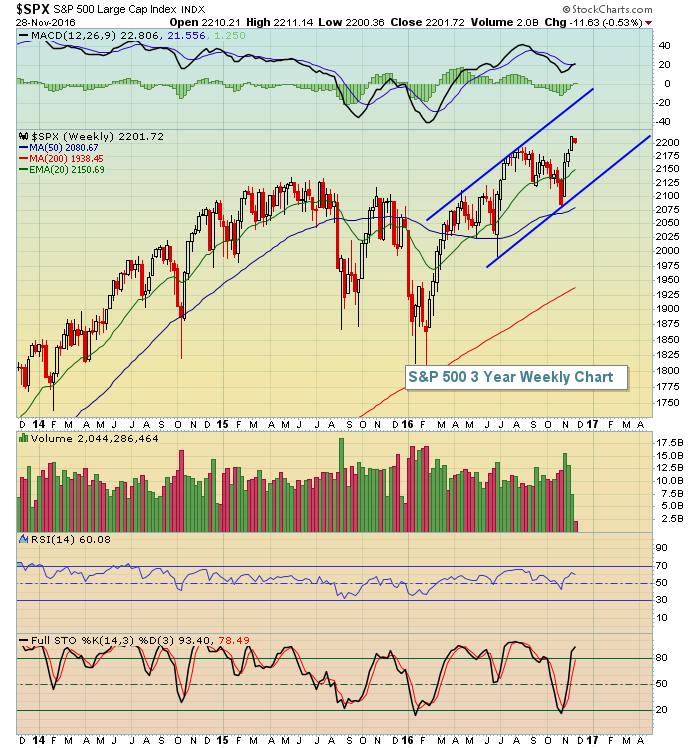 2200 would be the worst case scenario as long as this channel continues to play out. The upper end would probably be in the 2400 area, or another 8% higher. Future tests of this lower channel line should be watched closely.
Sector/Industry Watch
The Dow Jones U.S. Mining Index ($DJUSMG) staged a recovery of sorts on Monday, but was it enough to turn the tables on the persistent bears? I don't think so. The dollar's ($USD) weakness provided a short-term catalyst for gold. However, the dollar's strength of late looks to be sustainable to me, so I'm not looking for any type of precious metals rally to stick. Here's the downtrending mining index:
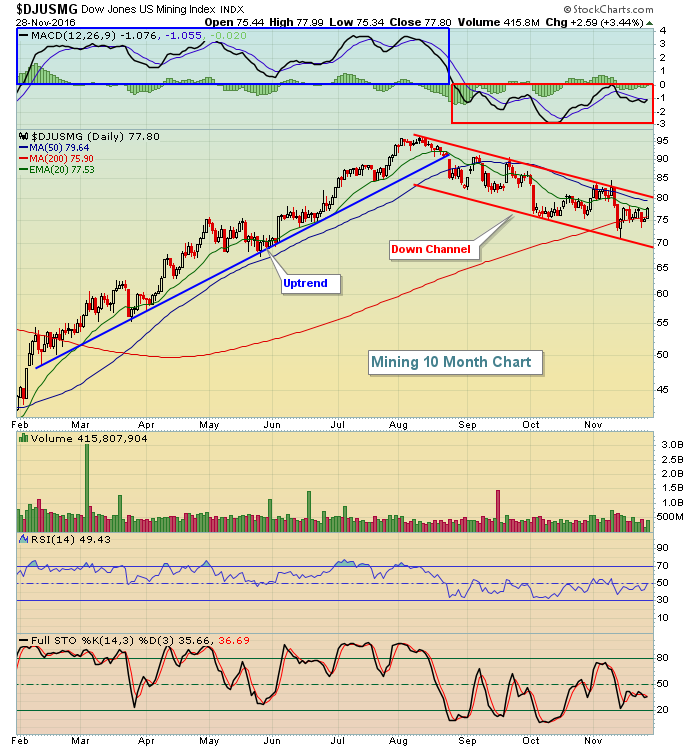 Life was great for the miners.....until late summer. The trendline was higher throughout much of the year, but we've seen the picture change quite notably the past 3-4 months. Yes, Monday's gains were nice, but they fall within the confines of the current down channel and I see nothing here that suggests the downtrend has ended. Momentum has been brutally negative (red rectangle highlights negative MACD) since the uptrend was broken and I'd look for another turn lower before this downtrend ends.
Historical Tendencies
Over the past week or so, I've discussed the December historical strength on the S&P 500 and Russell 2000. The NASDAQ also likes December as it's risen 27 of the last 45 years, producing an annualized return of 22.40%. That ranks December as the second best calendar month of the year, trailing only January's 28.21% annualized return.
Key Earnings Reports
(actual vs. estimate):
BNS: 1.21 vs 1.13
MNK: 2.04 vs 1.98
TIF: .76 vs .67
(reports after close, estimate provided):
ADSK: (.42)
SPLK: (.57)
Key Economic Reports
Q3 GDP released at 8:30am EST: +3.2% (actual) vs. +3.1% (estimate)
September Case Shiller HPI to be released at 9:00am EST: +0.4% (estimate)
November consumer confidence to be released at 10:00am EST: 101.0 (estimate)
Happy trading!
Tom


