Market Recap for Friday, November 11, 2016
Friday may not have seemed like a particularly bullish day as the Dow Jones gained just 39 points and the S&P 500 even lost a few points. But check out the Russell 2000's 2.46% gain! Historically, the Russell 2000 performs extremely well during the November and December months (see Historical Tendencies section below) and that was quite evident yesterday. It wasn't just the small caps that were bullish. The top four sectors were all our aggressive sectors - consumer discretionary (XLY, +0.57%), technology (XLK, +0.30%), financials (XLF, +0.28%) and industrials (XLI, +0.18%). I always like to see these four groups on the top of the sector leaderboard. If you're bullish, you want to see the money flow towards riskier areas, especially if the S&P 500 breaks out to another all-time high.
Automobiles ($DJUSAU) led the discretionary sector rally as General Motors (GM) broke to a 52 week high on very heavy volume, indicative of institutional buying. The broadcasting & entertainment index ($DJUSBC) also was strong on the heels of Disney's (DIS) positive reaction to quarterly earnings. The DJUSBC is featured below in the Sector/Industry Watch section.
One area where we're seeing a constant struggle of late is the price of crude oil ($WTIC). The WTIC has fallen nearly 20% over the past 3-4 weeks and is now at short-term price support. Check it out:
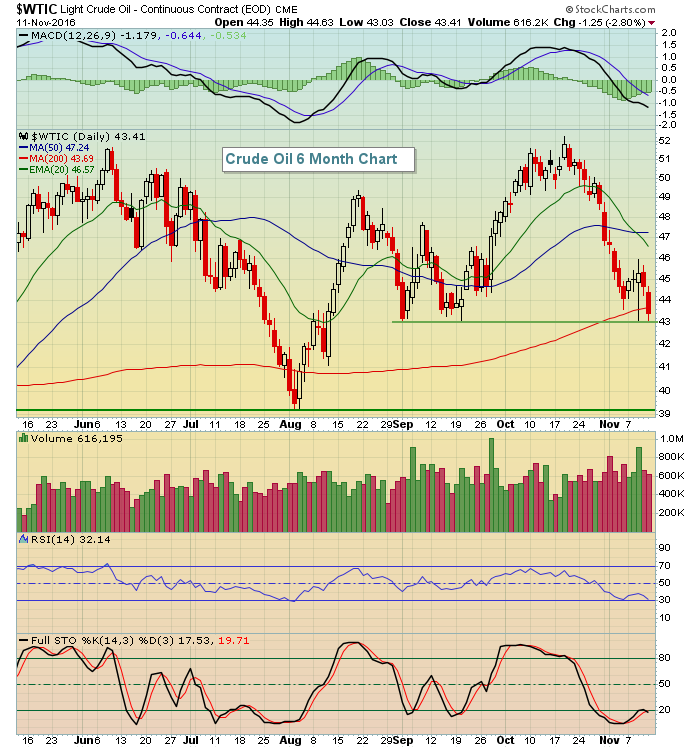 In early action today, crude oil has fallen below $43 per barrel. A reversal later in the session could signal an end to the relative weakness of late in the energy sector (XLE).
Pre-Market Action
Crude oil prices are down again this morning as it's now at $42.70 per barrel, or lower by 1.64%. This represents a short-term breakdown and will likely keep pressure on energy stocks on a relative basis. Energy has been a strong sector in 2016, but has been underperforming the S&P 500 over the five weeks.
Money continues to pour OUT of the bond market with corresponding yields surging. That hasn't changed with the start of a new week as the 10 year treasury yield ($TNX) is soaring again this morning, up 9 basis points to 2.21% at last check.
Earnings will begin to slow down this week from the torrid pace of the last few weeks.
U.S. futures are higher this morning with the Dow Jones futures up by 66 points with 30 minutes left to the opening bell.
Current Outlook
I follow relative ratios to evaluate the strength of rallies and the likelihood a rally is sustainable. It's clear from last week's action that the current rally is strong. Check out these strengthening relative ratios:
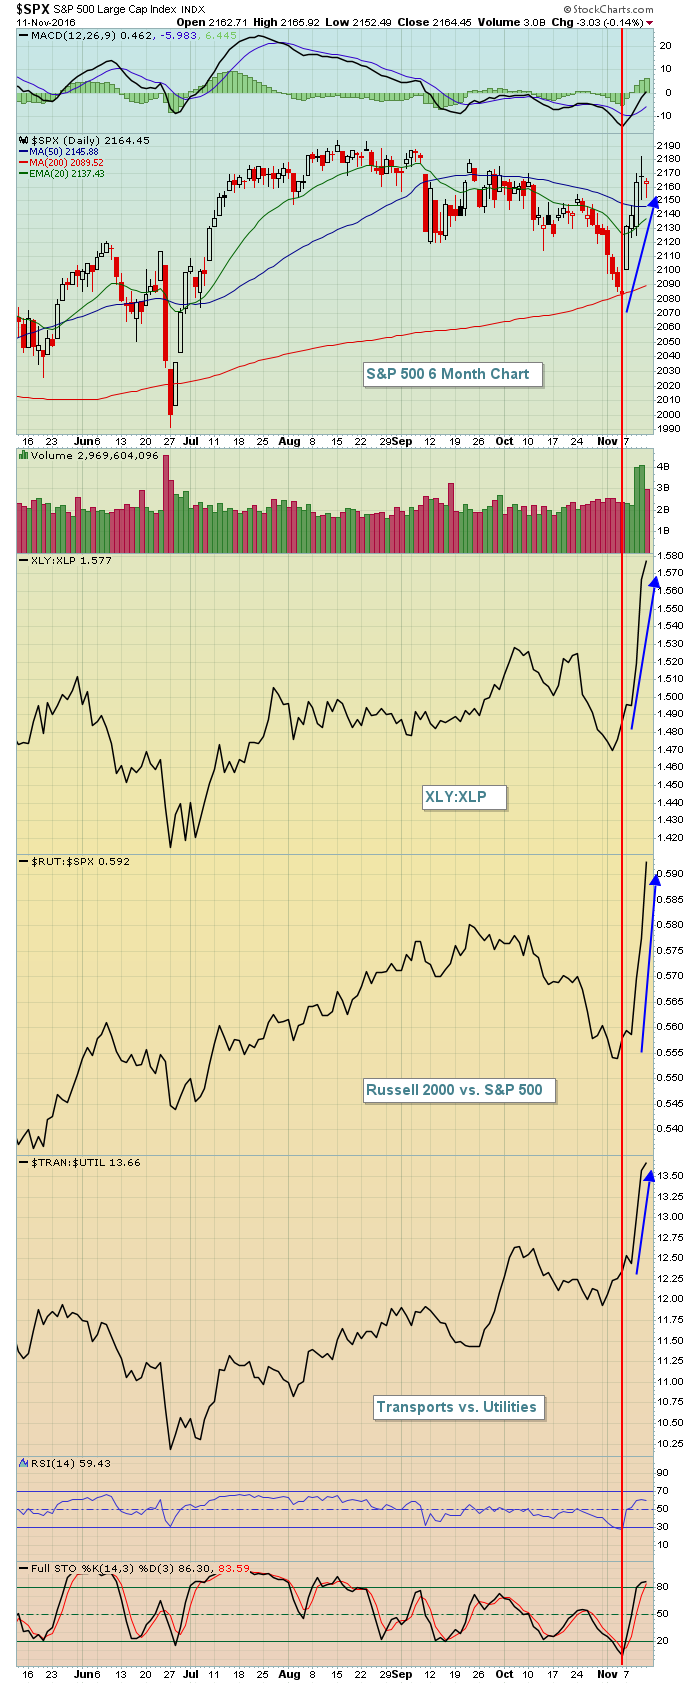 Based on this analysis alone, an S&P 500 breakout would be very bullish given this rotation to "risk on" areas of the market.
Sector/Industry Watch
The Dow Jones U.S. Broadcasting & Entertainment Index ($DJUSBC) made a significant breakout on Friday, led by Walt Disney's solid reaction to its earnings report:
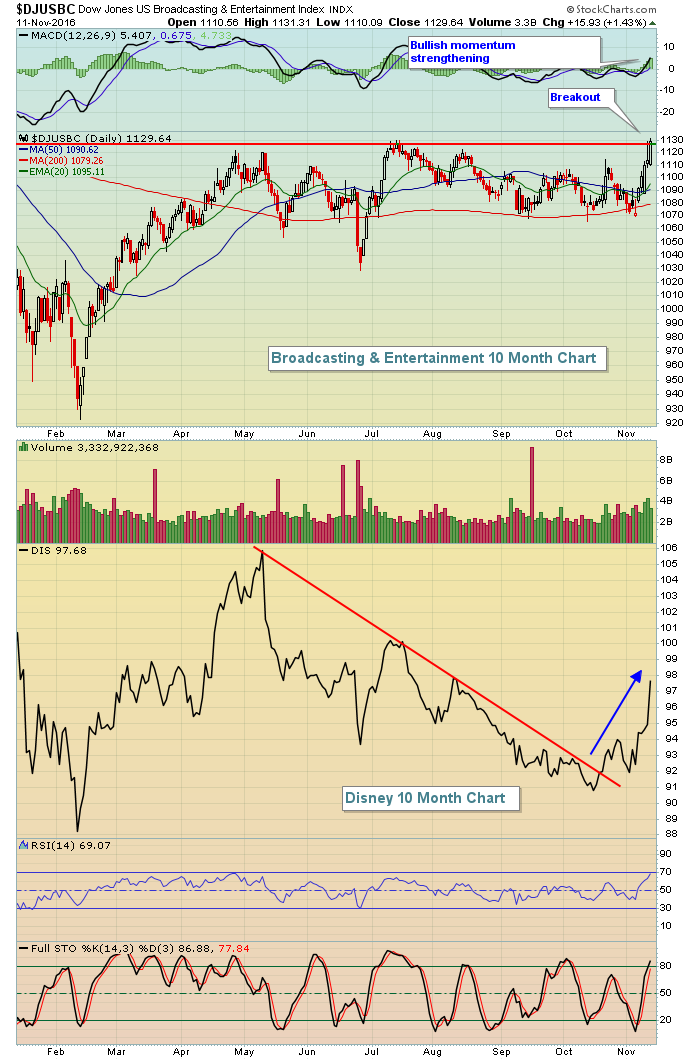 The price momentum appears to be accelerating to the upside so I'd look for fresh new highs in the upcoming days and weeks, especially if we see another breakout in the S&P 500.
Monday Setups
Every Monday, I discuss setups during my Trading Places LIVE webinar which begins at 1pm EST. Today will be no exception so please join me by REGISTERING HERE. You do need to be a StockCharts.com member to attend this webinar, but here's a link to a 10 day FREE trial if you're not already a member. I'd love to have you join me today while you check out all that StockCharts.com has to offer.
Here was a recent setup from early September:
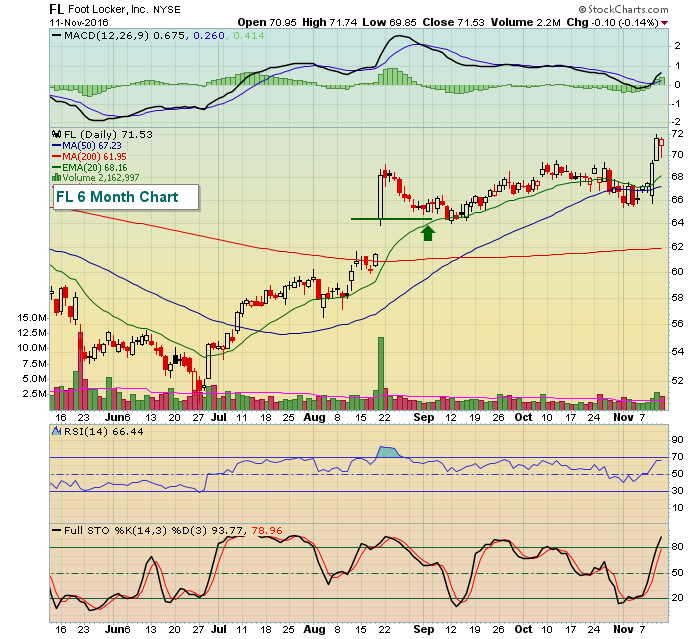 After the earnings-related gap higher in August, FL became very overbought, but when it pulled back to the top of gap support, its RSI had dropped back into the 50s and the reward to risk was much stronger. It's since performed very well and remains healthy technically.
For this week, Adobe Systems (ADBE) appears to be at an initial entry area, although a case could be made to save some powder for a possible lower entry. Check it out:
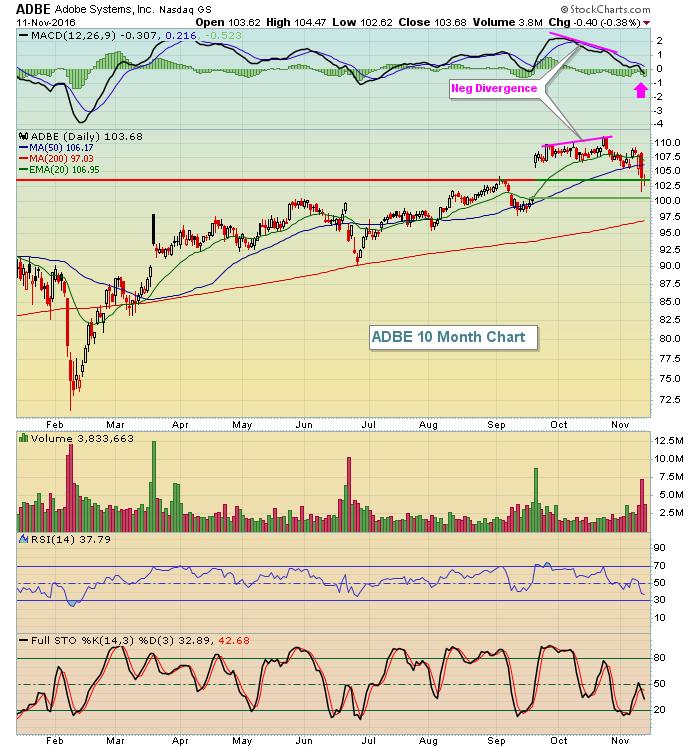 On ADBE's recent price high in the latter half of October, price momentum slowed as evidenced by the negative divergence highlighted above. Also note that volume slowed on that last high as well, further indication of slowing momentum. Patience paid off here as the MACD reset to its centerline and now ADBE's RSI has dipped just below 40 where ADBE has previously been a strong buy. I'll discuss ADBE and others during my webinar later today so please register and join me!
Historical Tendencies
Below is a chart that compares the performance of the Russell 2000 vs. the benchmark S&P 500 by calendar month:
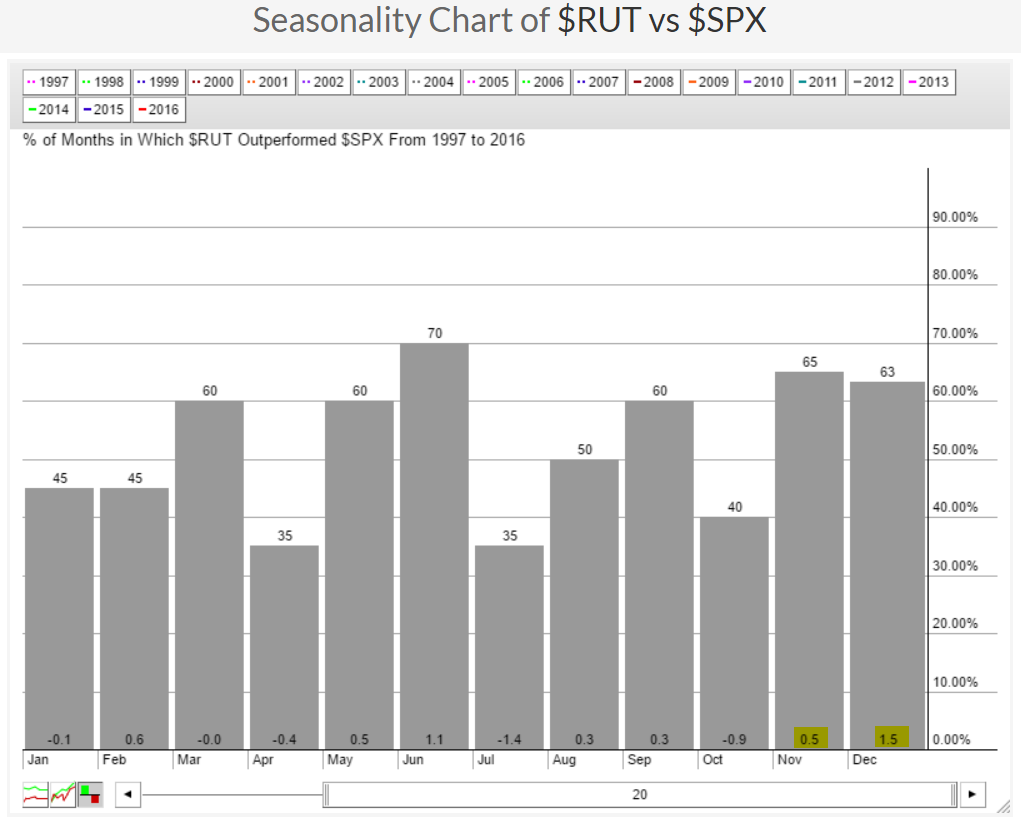 The highlighted numbers at the bottom tell us that the Russell 2000 averages outperforming the benchmark S&P 500 index by 0.5% in November and 1.5% in December. This is the time of the year when small caps typically outperform.
Key Earnings Reports
(actual vs. estimate):
TDG: 3.10 vs 3.07
WWAV: .35 vs .38
Key Economic Reports
None
Happy trading!
Tom


