Market Recap for Monday, November 1, 2016
A couple reminders before we get into the action. First, today's webinar will be very interesting given the breakdown on the S&P 500 and Russell 2000 yesterday. It's 30 minutes of charts, key technical levels and market commentary. The webinar begins at 12:00pm EST today and I'd love to see you there. You can REGISTER HERE.
Next, if you enjoy these articles, please subscribe to my blog. At the bottom of each article, there's a box provided to enter your e-mail address. Once you've subscribed, my article will be sent directly to your e-mail address immediately after being published.
Now to the action.....
While we can always get "head fakes", the S&P 500 yesterday closed at its lowest level since July 7th. The 2112 close pierced price support that had been holding for the last four months. In addition, this price breakdown was accompanied by a soaring volatility index ($VIX) and key relative ratios that tell us that money has been rotating towards defense over the last 1-2 years. The price breakdown guarantees nothing as far as future market direction, but it's important to note that conditions are now ripe for a much further decline and potentially a bear market. Action from here will determine that. Here's the current technical outlook for the S&P 500:
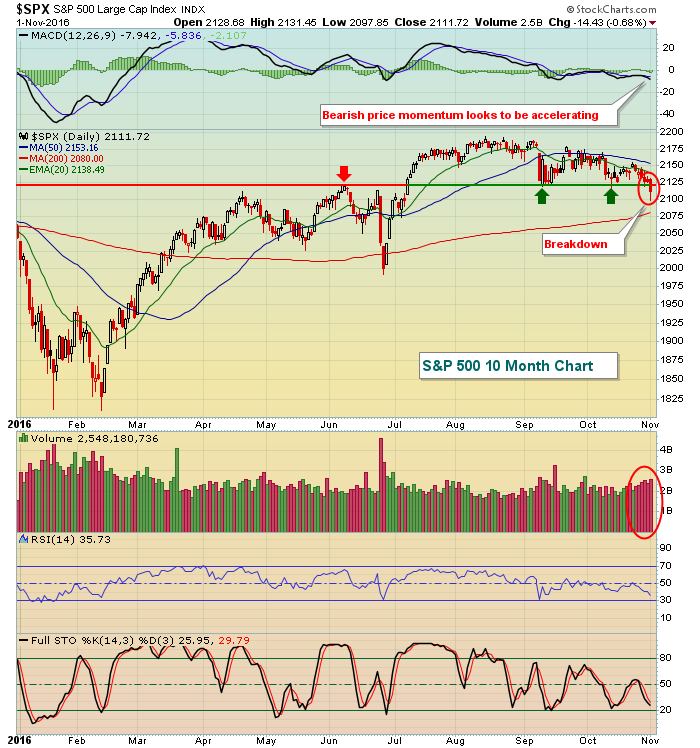 Volume is increasing also, which adds to the overall bearish feel of this decline. From a bullish perspective, it's important to quickly regain the 2120 level, suggesting this is simply a head fake. Short of that, this daily chart indicates more weakness ahead. Any time I see deterioration on the daily chart, I look to the longer-term weekly chart to see whether that confirms. Here's the longer-term view of the S&P 500:
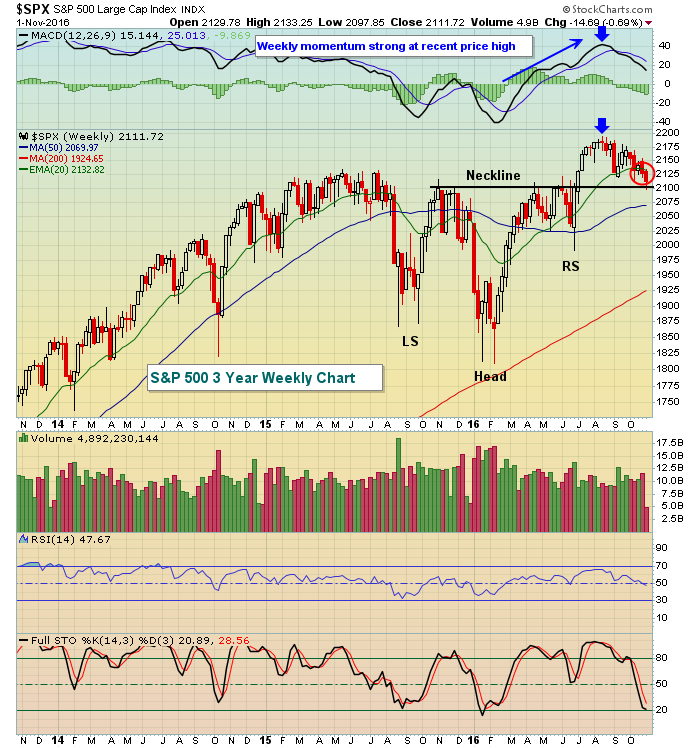 There are two key points here - one bullish and one bearish. First, I'll make the bullish argument. There was a bullish inverse head & shoulders continuation pattern that confirmed on the neckline breakout in July with a measurement to 2375-2400. Neckline support at 2100 area is critical to this pattern, however. The bearish argument is that with accelerating price momentum (ie, higher MACD that accompanied higher price action - blue arrows above), the rising 20 week EMA typically provides excellent support but we've broken well beneath that level. Keep in mind, however, that these are weekly candles so we'll need Friday's close to make a confirmed call here.
Energy (XLE) was up one penny on Monday and represented the only sector to finish in positive territory. Utilities (XLU) was clearly the worst sector, losing 1.82% - more than double the loss of any other sector. Technology (XLK), industrials (XLI) and consumer discretionary (XLY) were the next worst performers and are all considered aggressive sectors. None of these sectors lost price support, however, which still supports the bullish argument. I've provided a chart of the XLI in the Sector/Industry Watch section below.
Pre-Market Action
Following the S&P 500's lowest close in four months, global markets sold off as you might expect. Tokyo's Nikkei ($NIKK) tumbled 308 points, or 1.76%, after approaching its highest level in 9 months (April high) near the 17600 level. In Europe, all key markets are lower, but not substantially so. Apparently, they're waiting to see how the U.S. market reacts to the Fed announcement later today.
Dow Jones futures are down 30 points with roughly 45 minutes left to the opening bell. The Dow Jones actually held its recent price lows, unlike the S&P 500. It would add more bearishness to see all of our major indices printing new lows in unison.
The internet space will be impacted after the close today as Facebook (FB) will report its latest quarterly results. Wall Street estimates that FB will earn .76.
Finally, the ADP employment report showed jobs came in below expectations at 147,000, below the 170,000 forecast.
Current Outlook
I want to focus on two charts right now - the volatility index ($VIX) and key relative ratios. High volatility is associated with bear markets. A bear market requires high volatility and fear to sustain itself. We saw it during the previous two bear markets from 2000-2002 and 2007-2009. The VIX soared and, more importantly, never lost support in the 16-17 range throughout the balance of both respective bear markets. Yesterday, the VIX soared and closed above 18 - at its highest closing level since the Brexit-related selloff in June. The VIX did, however, fall 10% from its intraday high over 20. Nonetheless, the VIX closed at a new recent high and the S&P 500 closed at a new recent low. That combination should, at a minimum, have you very nervous if you're a trader on the long side. Here's the VIX chart:
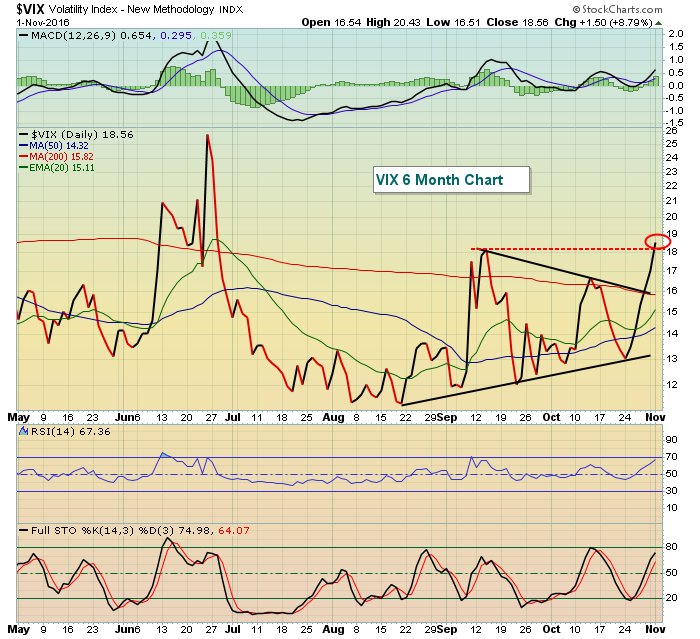 The VIX had been squeezing in a triangle pattern and we've been awaiting a breakout. We saw that breakout and also an absolute breakout as the VIX firmly cleared 18 resistance on the close. A continuing rising VIX would be extremely bearish for equities.
While the current breakdowns are definitely alarming, there's been a shift in investor psychology over the past 1-2 years that I've been warning about. Money, on a relative basis, has been rotating away from aggressive areas and that's happened in the past just before bear markets. I look for price breakdowns to confirm this bearish rotation and we may have received just that with Monday's selling. Here's a current look at these relative ratios and why they may be signaling more price weakness ahead:
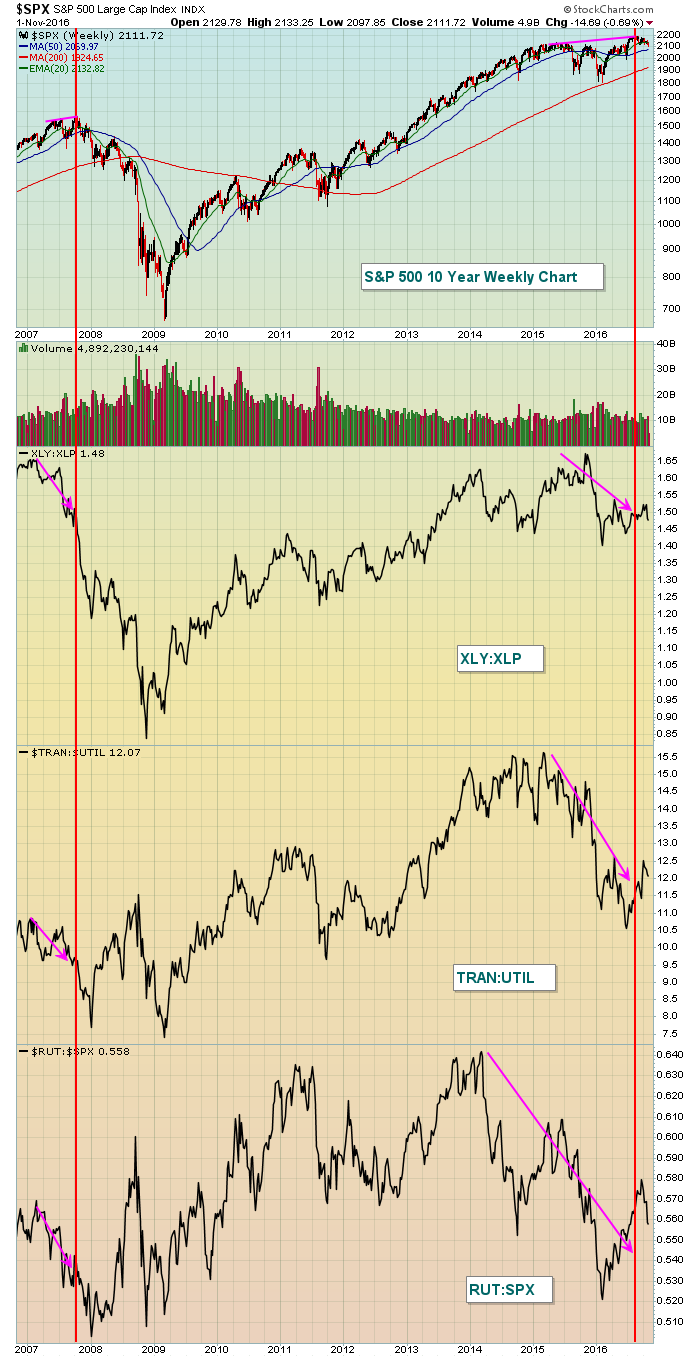 The first red vertical line shows the 2007 bull market high. If you were only following price action, you would not have noticed that money was rotating heavily towards defensive areas of the market at that time. Put another way, defensive stocks were leaders during the last leg of the bull market. You can also see that during the ensuing bull market from 2009 through 2014, these relative ratios mostly moved higher - a bullish signal as it indicates that market participants were in "risk on" mode. That behavior helps to sustain bull markets. The past two years, however, we've seen deteriorating relative ratios very similar to 2007. But there's always the chance that prices move up and money rotates back to aggressive areas. That's why I don't turn bearish until I begin to see price breakdowns to confirm these relative ratio warning signs. The breakdown in the S&P 500 yesterday below 2120 was the first major price breakdown in my view. The bulls will be tested the balance of this week with much uncertainty on the table as the Fed announcement comes out later today at 2pm EST, nonfarm payrolls hit the Street on Friday, and of course the U.S. presidential election is here in a week.
Sector/Industry Watch
Industrial stocks (XLI) have been a middle of the pack performer the past few months and its SCTR ranking of 55 would confirm that. Should we be entering a much more bearish period for equities, I'd expect to see breakdowns among the aggressive sectors. The XLI was close but the rally in the final two hours provided the group a kick save. Here's the visual:
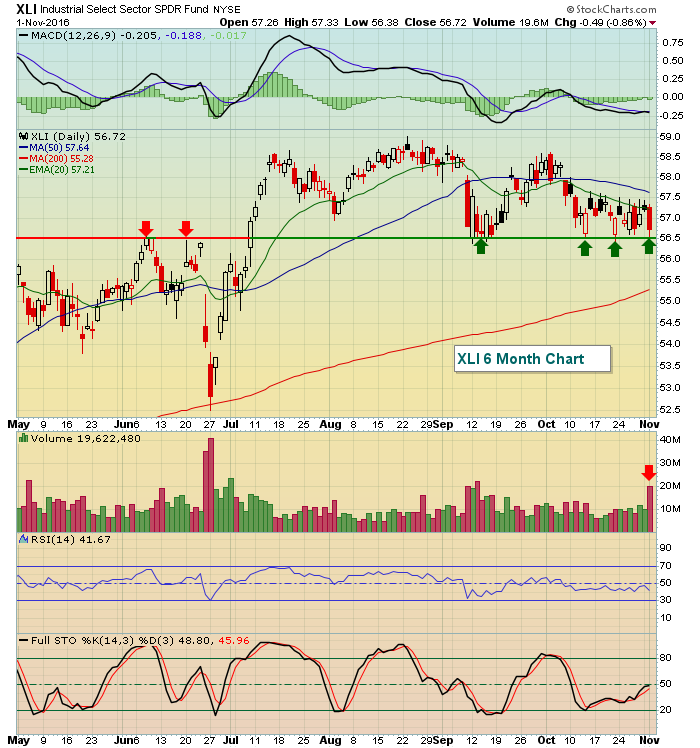 Volume was very heavy in this sector on Monday and the XLI was in breakdown mode at 2pm EST. It was encouraging to see the rally into the close, but an intraday move beneath 56.38 would begin to paint a much more bearish picture. We have now seen multiple saves at 56.50 so clearly this is a big level technically on a closing basis.
Historical Tendencies
The NASDAQ has produced annualized returns of 18.98% during the month of November since 1971, ranking it as the third best calendar month of the year. January's 28.21% and December's 22.40% rank first and second, respectively.
Key Earnings Reports
(actual vs. estimate):
ABC: 1.30 vs 1.22
ADP: .86 vs .77
AGN: 3.32 vs 3.57
BABA: .63 vs .47
CLX: 1.36 vs 1.42
DLPH: 1.50 vs 1.42
EL: .84 vs .79
HSIC: 1.68 vs 1.65
Q: 1.00 vs 1.00
SE: .31 vs .25
SRE: 1.02 vs .97
TEL: 1.27 vs 1.19
TRP: .59 vs .57
TWX: 1.83 vs 1.36
VMC: 1.01 vs 1.12
ZTS: .52 vs .46
(reports after close, estimate provided):
AIG: 1.21
ALL: 1.24
FB: .76
MET: 1.14
MRO: (.19)
PRU: 2.50
QCOM: .98
Key Economic Reports
October ADP employment report released at 8:15am EST: 147,000 (actual) vs. 170,000 (estimate)
FOMC announcement to be released at 2:00pm EST
Happy trading!
Tom


