Market Recap for Thursday, December 1, 2016
It was another very strange day on Wall Street. The Dow Jones finished the session Thursday with a gain of 68 points, closing at 19192 and another all-time high. The NASDAQ appeared to be trading in another world as technology was crushed, leading to a loss of 73 points on the NASDAQ. Financials (XLF, +1.73%) and industrials (XLI, +0.66%) remain the relative leaders. Over the past month, the XLF and XLI have gained 16.48% and 10.75%, respectively, while technology has dropped 1.04%. To say that technology is currently out of favor would be a major understatement.
Banks ($DJUSBK) continue to power ahead on the rise in the 10 year treasury yield ($TNX). The following charts shows this relationship quite well:
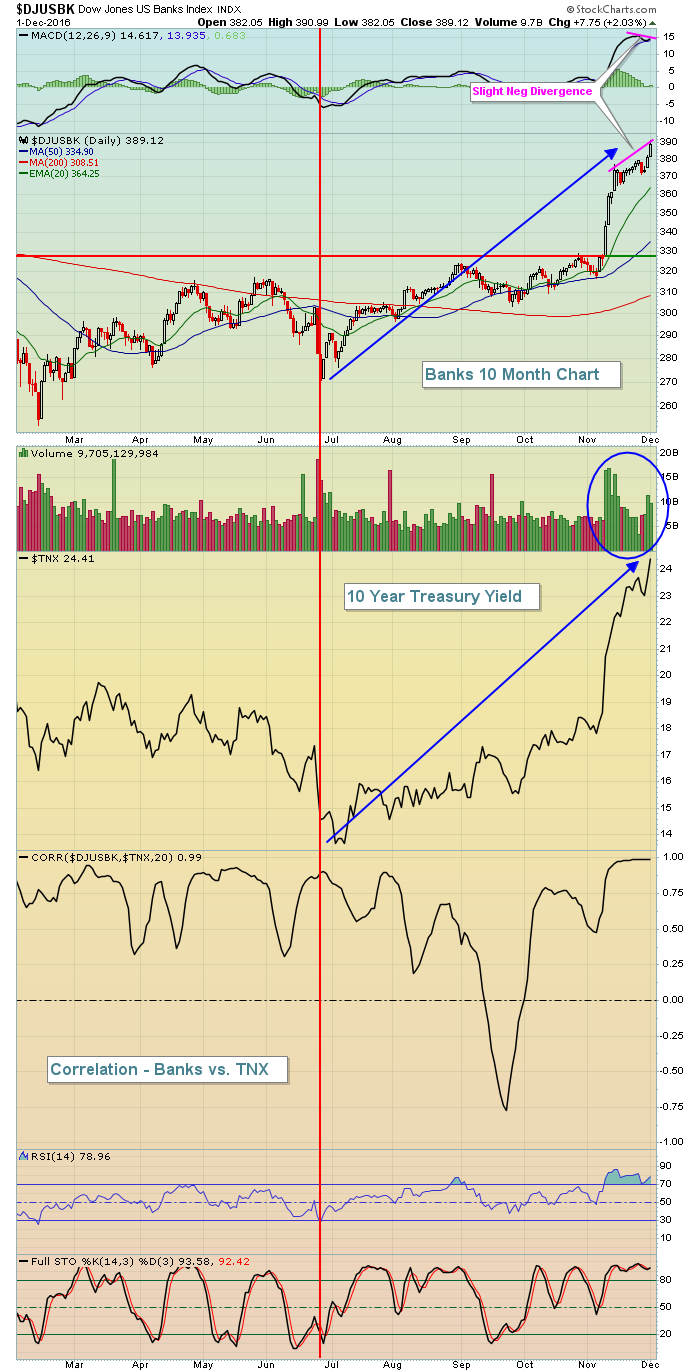 There are several points to make here. First, the rally in bank stocks began post-Brexit and the November surge occurred after the presidential election. Traders are betting on rising rates and deregulation, both of which will result in higher bank profits. The blue lines reflect the rising rates since late June and the parabolic rise in bank stocks since that time as well. The one negative on this chart is that the latest breakout is occurring with a negative divergence in play. The lower MACD suggests price momentum is slowing. Keep in mind, however, that the MACD does not take into account volume. Volume the past couple trading sessions has exploded higher once again so the volume is painting a different picture regarding momentum. Nonetheless, failure to hold the latest breakout in the 370-380 range could become short-term problematic. Finally, the correlation indicator shows that bank stocks and the TNX are positively correlated, meaning that they tend to move in the same direction. Outside of the blip in September, the correlation indicator remained above 0 for the last 10 months, many times at or near +1, the highest positive correlation reading.
Industrials were led by the majority of its industry groups, including industrial suppliers ($DJUSDS), which now has cleared its April high. But this group still has a ways to go to test the 2013/2014 double top. Check it out:
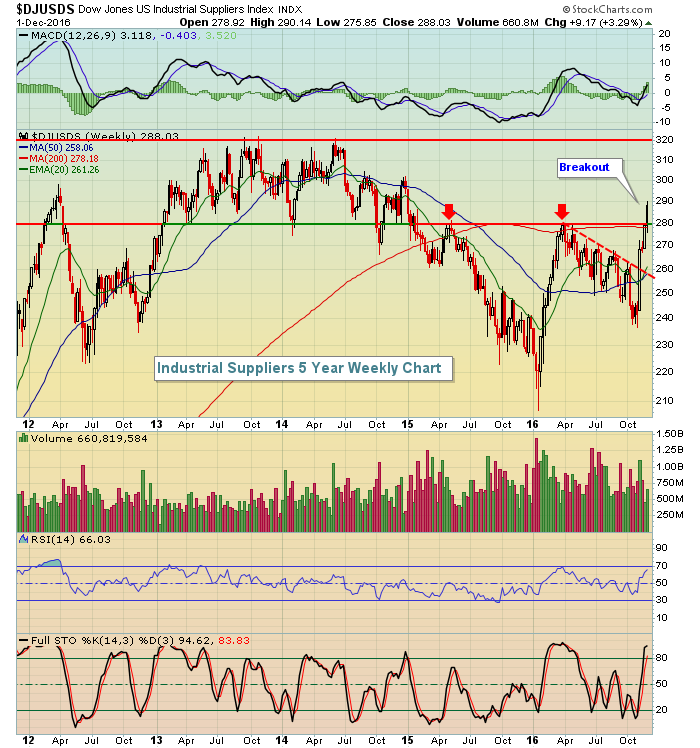 The 2016 downtrend was broken during this advance and now we've cleared price resistance near 280. I suspect we'll see the DJUSDS rise to test that 320 resistance and that will represent a huge test of resistance.
Pre-Market Action
Crude oil prices ($WTIC) are taking a breather after exploding 13% higher the past two trading sessions. The WTIC is lower by 0.4% in pre-market action as traders react to the latest nonfarm payroll numbers. The bond market has mostly yawned with the 10 year treasury yield ($TNX) dropping one basis point to 2.43% at last check.
Asian markets were mostly lower overnight and that weakness has spread to Europe this morning. U.S. futures are lower as well with Dow Jones futures down 27 points at last check.
Nonfarm payrolls were reported at 178,000, slightly better than the forecast of 170,000. The unemployment rate fell to 4.6%, much better than the estimate of 4.9%.
Current Outlook
One of my relative ratios that I watch closely is the relationship between transportation stocks ($TRAN) and utility stocks ($UTIL). You can plot this at StockCharts by simply typing $TRAN:$UTIL as the symbol. Take a look at the following monthly chart:
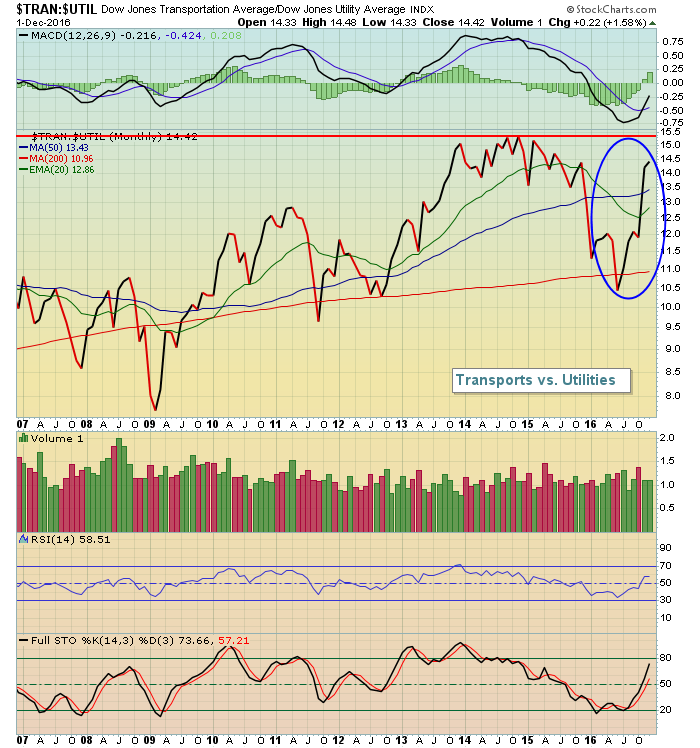 The blue circle highlights the relative strength of transportation stocks vs. utility stocks since late June. A break above 15.4 (red horizontal line) on this chart would be very bullish in my view and suggest the current S&P 500 rally is sustainable - at least over the next 4-6 weeks. When this relative ratio rises, it's an indication that traders are moving into a "risk on" mode, a mode that typically results in higher stock prices.
Sector/Industry Watch
What's going on with techology (XLK, -2.06%)? The group had been carrying the market on its shoulders, but not any longer. Semiconductors ($DJUSSC) took a big hit yesterday and this is how three of the key industry groups stack up currently:
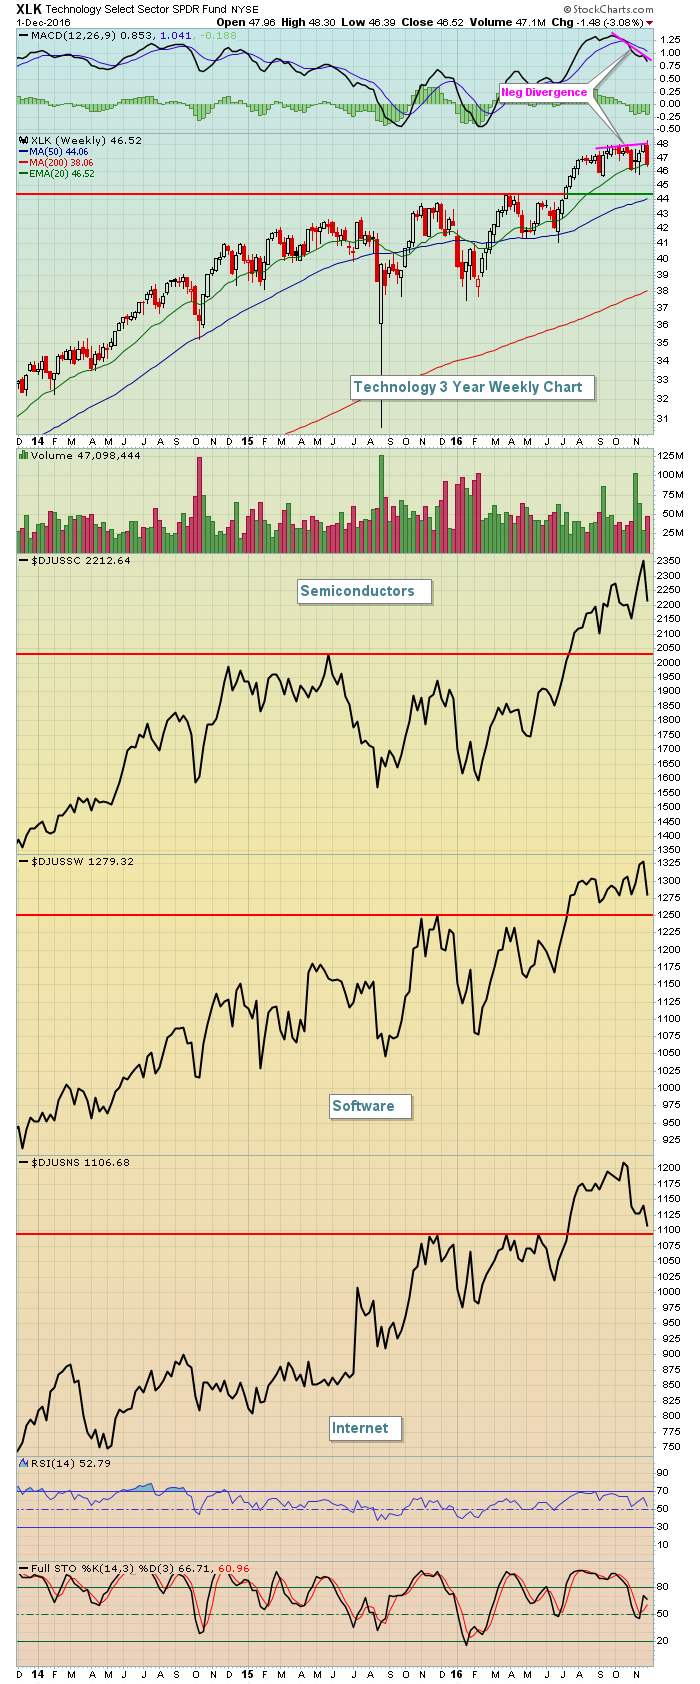 Taking a longer-term weekly view helps to put things in perspective. Technology moves fast in both directions and corrections can be very painful - as we're feeling now. But three key industry groups remain above price support despite all the harsh selling of late. Internet stocks ($DJUSNS) appear to be in the most danger of a key breakdown. Watch the 1095-1100 support level there.
A negative divergence emerged on the XLK chart, which is highlighted by the pink lines above. I look for negative divergences to result in 50 period SMA tests. Currently, the 50 day SMA resides at 44.06, another 5% lower than Thursday's close. So it's possible we'll see more pain before buying kicks in.
Historical Tendencies
I recently wrote a DITC blog article about the potential reward of accumulating renewable energy stocks ($DWCREE), which have lagged badly for more than two years. Well, it just so happens that the DWCREE is the best performing industry group during the month of December. In fact, the December through February period has historically been the best time to invest in this group. Here are the DWCREE's average monthly returns for each of the next three calendar months:
December: +7.2%
January: -2.5%
February: +8.5%
Key Earnings Reports
None
Key Economic Reports
November nonfarm payrolls released at 8:30am EST: 178,000 (actual) vs. 170,000 (estimate)
November private payrolls released at 8:30am EST: 156,000 (actual) vs. 155,000 (estimate)
November unemployment rate released at 8:30am EST: 4.6% (actual) vs. 4.9% (estimate)
November average hourly earnings released at 8:30am EST: -0.1% (actual) vs. +0.2% (estimate)
Happy trading!
Tom


