Market Recap for Tuesday, December 6, 2016
I've been waiting to see if the German DAX would join the S&P 500 in breakout territory and, thus far, I'm getting my answer today with the DAX currently up 155 points, or 1.44%, this morning which cleared 2016 overhead resistance at 10800. Here's a look at that breakout and the significance:
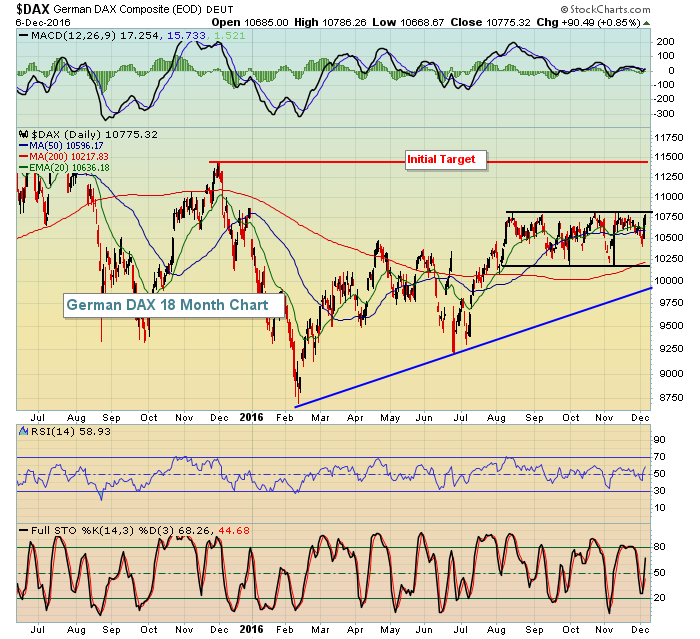 The chart above does NOT reflect this morning's gains, but the surge will clearly exceed highs established in its recent four month trading range. Note the RSI reading of just 58 as we entered today's trading session. The sideways trading action has squelched momentum so this breakout is likely just beginning. I look for this rally on the DAX to continue to test price resistance from the high a year ago just beneath the 11500 level. I would also expect this rally to be a quick one.
In the U.S. on Tuesday, we saw leadership once again from financials (XLF, +0.87%). Technology's (XLK, 0.30%) gain was also noteworthy because it was led, in part, by the Dow Jones U.S. Semiconductors Index ($DJUSSC) as this influential industry group held recent trendline support. Check it out:
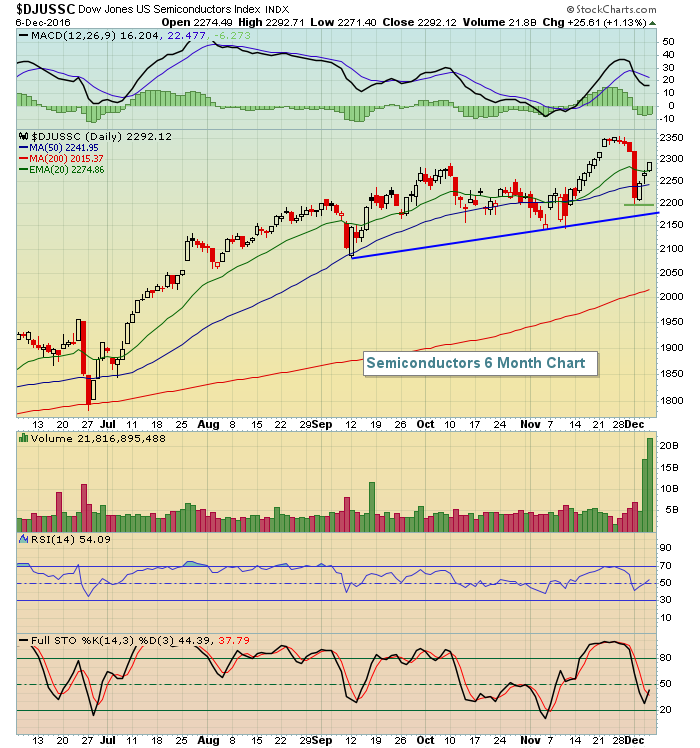 The DJUSSC corrected more than 100 points last Friday alone, losing both rising 20 day EMA support and its 50 day SMA. That could have led to more selling down to the early November low near 2140, but it didn't. It's since recovered with RSI continuing to hold support near 40.
Pre-Market Action
Crude oil ($WTIC) has fallen back to $50.29 per barrel this morning, down 1.26%. That may put a damper short-term on energy stocks, which have been on fire during the latest run up in crude. Look to see if technology can return to relative leadership to carry our major indices through recent all-time highs, especially on the tech-laden NASDAQ.
Asian markets were up fractionally overnight, and as I mentioned earlier, gains in Europe, especially on the DAX, have lifted those markets as we approach the opening bell here in the U.S.
Dow Jones futures are flat this morning with a bit of relative weakness on the NASDAQ in pre-market trade. The more aggressive Russell 2000 and NASDAQ, however, led the action yesterday so we'll see if these two can regain that leadership role by day's end.
Costco (COST) reports its latest quarterly results after the closing bell today.
Current Outlook
A couple days ago, I pointed out that the S&P 500 was hitting oversold territory on its hourly chart and that we could certainly see a quick rally back to the recent highs. As you can see below, that's been the case. But now we face short-term oversold conditions at resistance. Here's the visual:
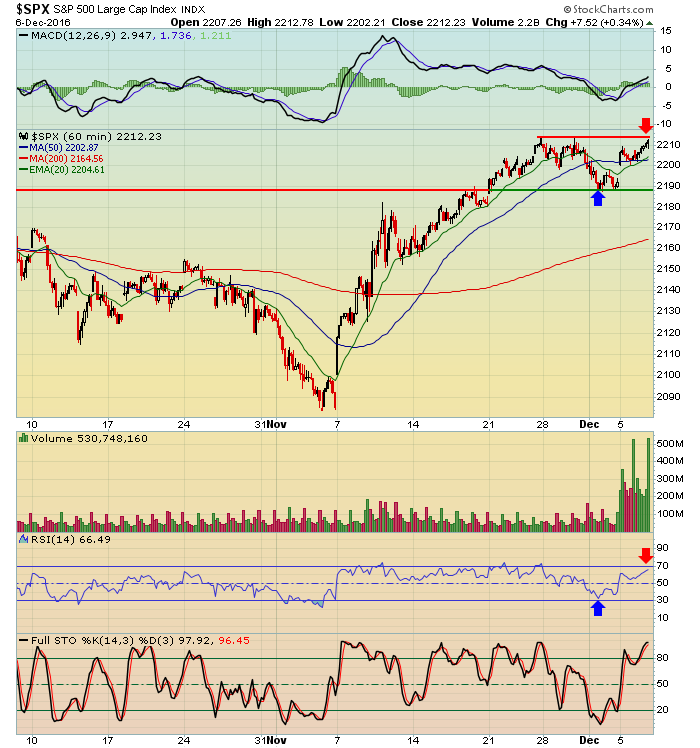 Keep in mind that we're in an uptrend and the market's tendency is to stay overbought longer than oversold. So I wouldn't be a seller just because we're short-term overbought. In the second week of November, you can see we remained overbought for several days during an explosive rally. A break above the red resistance line could result in a similar rally.
Sector/Industry Watch
The selloff in treasuries and the corresponding rise in treasury yields have sent many areas of financials (XLF) rocketing higher. But higher rates aren't great for all industry groups within the sector. Take, for instance, the REITs. Over the past three months, the Dow Jones U.S. Retail REITs Index has fallen 16.22%. This compares to a 24.24% gain in the Dow Jones U.S. Banks Index ($DJUSBK). Price momentum appears to have slowed on the sell side based on the positive divergence that's developed. Take a look and see what you think:
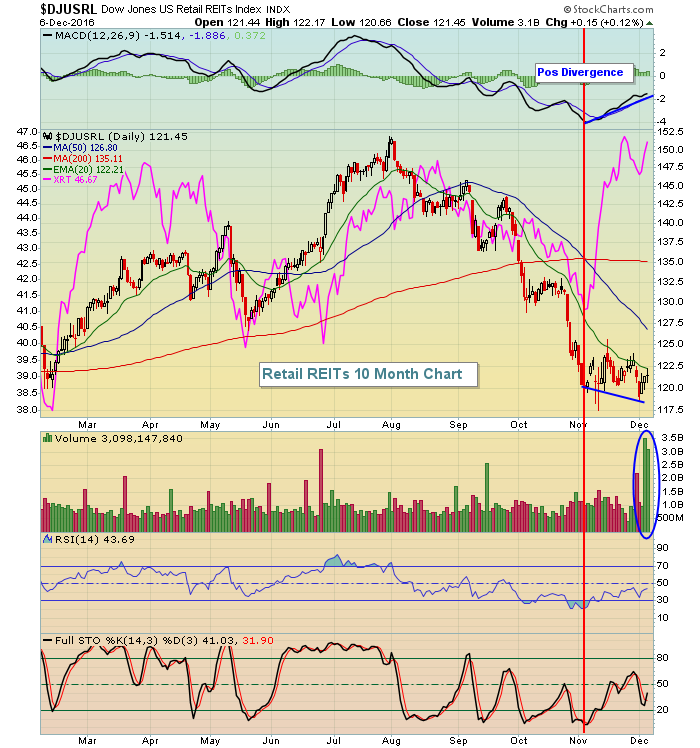 The retail ETF (XRT) and the DJUSRL tend to move in the same direction, but you can see that relationship has completely changed over the past month. I believe we'll see this divergence repaired. Obviously, that means the XRT may fall....or the DJUSRL may climb....or perhaps a bit of both. Given that the 10 year treasury yield ($TNX) is close to 2.50% resistance, my expectation would be that the DJUSRL will rally above its declining 20 day EMA for the first time in two months. The positive divergence suggests an upcoming 50 day SMA and MACD centerline test, at which time we'll see whether this is just a short-term bounce to unwind our momentum oscillators or if it's a more meaningul reversal.
Historical Tendencies
I described the bearish tendencies for the Russell 2000 for the period December 7th through December 15th in my article yesterday. Here's a better analysis of December in its entirety for small caps since 1987:
December 1 - 6: +63.59%
December 7-15: -42.98%
December 16-31: +77.90%
Those are annualized returns over nearly three decades. And market timing doesn't matter? Pfffffft.
Key Earnings Reports
(actual vs. estimate):
No key earnings reports this morning
(reports after close, estimate provided):
CASY: 1.57
COST: 1.19
LULU: .43
UNFI: .62
Key Economic Reports
None
Happy trading!
Tom


