Market Recap for Tuesday, January 10, 2017
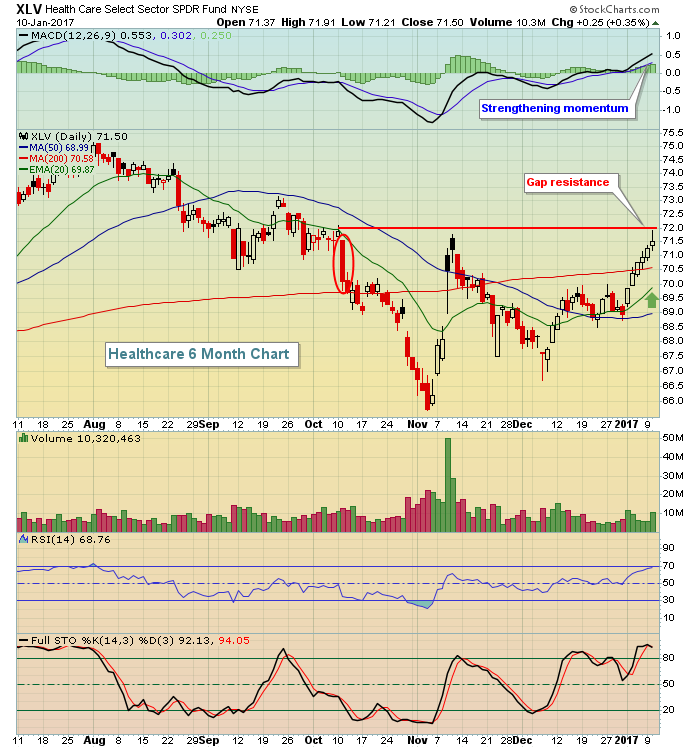
It was another bifurcated market day on Tuesday, but under the surface there was much more bullishness than on Monday. For one, six sectors rose instead of one. Secondly, all of the aggressive sectors gained ground, led by industrials (XLI, +0.42%) and consumer discretionary (XLY, +0.36%). Healthcare (XLV, +0.35%), the hottest sector in 2017 thus far, extended its winning streak to six consecutive sessions, but may have hit a short-term wall of resistance putting its winning streak in jeopardy. Take a look:
 Airlines ($DJUSAR) spiked off their 20 day EMA on Tuesday as crude oil prices ($WTIC) fell to their lowest level since closing at $49.77 per barrel five weeks ago. Airlines are lifted primarily by better economic conditions and rising demand, but crude oil is a huge line item so falling prices certainly didn't hurt yesterday. While the DJUSAR was the best performing industry group within the industrials, the second best - the Dow Jones U.S. Heavy Construction Index ($DJUSHV) - was perhaps the most notable technically. Check out the Sector/Industry Watch section below for more details.
Pre-Market Action
Earnings and economic news will remain very quiet until Friday morning when a plethora of economic reports hit The Street in addition to four very key earnings reports from the banking industry (JPM, WFC, BAC, PNC). Strength in Hong Kong overnight was apparent once again as the Hang Seng Index ($HSI) tacked on yet another 190 points last night. Europe is mixed this morning with fractional gains and losses.
Crude oil prices ($WTIC) are attempting a recovery after losses the past two days totaled nearly 6%. The 10 year treasury yield ($TNX) is nearing a 50 day SMA test, currently at 2.31%, which would alleviate the negative divergence that printed when the TNX was at 2.60% in mid-December.
Dow Jones futures are flat as we approach the start of a fresh trading day.
Current Outlook
I'm watching crude oil prices ($WTIC) very closely. I didn't like the technical failure of crude to hold neckline support near $52 per barrel, but a quick short-term breakdown beneath that level isn't the end of this energy run so long as the rising 20 week EMA, currently at $49.40, holds. I believe that the recent breakout on the weekly chart at $52 per barrel is the start of a much longer uptrend. If that's true, pullbacks should generally hold support at the rising 20 week EMA. Here's the current look:
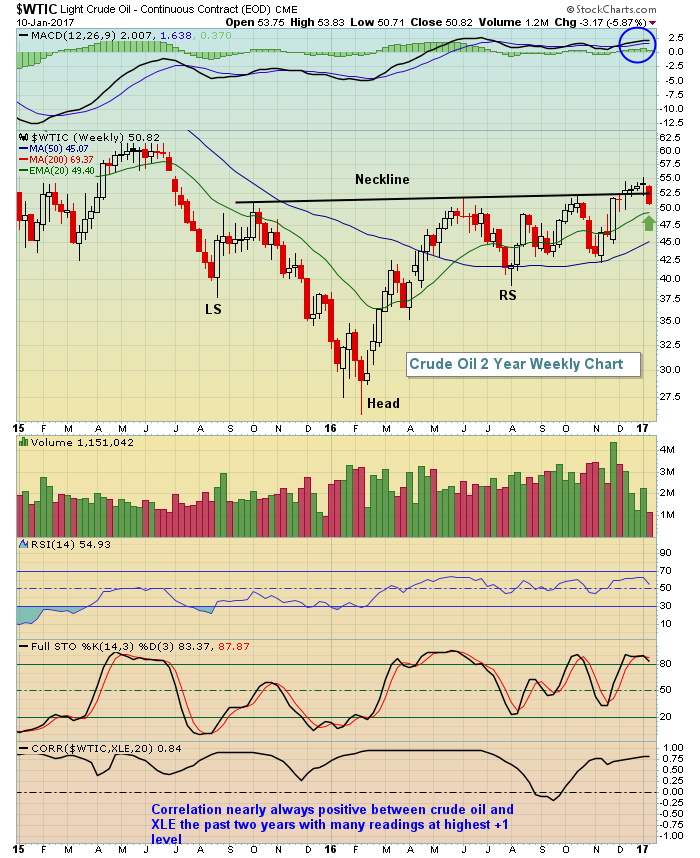 This week's candle is a filled red candle thus far and the close currently is beneath neckline support, but above rising 20 week EMA support. The blue circle shows weekly momentum strengthening in the form of a rising weekly MACD. That suggests 20 week EMA tests (green arrow) should provide solid support on pullbacks. I expect we're getting very close to a significant bottom in crude oil prices and, based on the correlation indicator shown above, that should bode well for the energy ETF (XLE) as we move forward. Check out the Historical Tendencies section below for a reminder on how well the XLE tends to perform vs. the benchmark S&P 500 from now through April.
Sector/Industry Watch
Negative divergences with respect to the MACD typically create more sellers as bullish momentum fades. That's been quite apparent with respect to heavy construction ($DJUSHV). A negative divergence emerged here as the overall market was peaking in the second week of December. Take a look at what's transpired since:
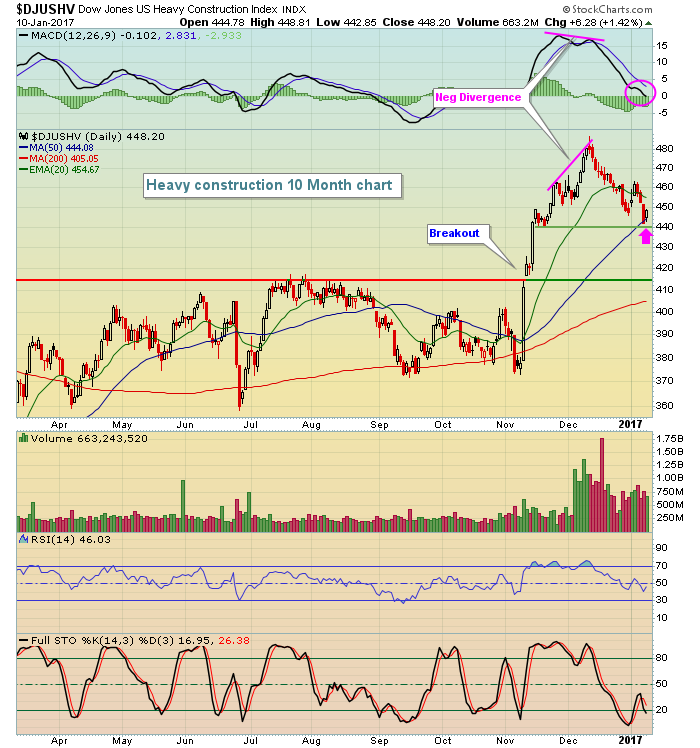 The pink arrows highlight exactly what I look for after a negative divergence emerges - namely, a 50 day SMA test and/or a MACD centerline test. In this case, we have both. The 50 day SMA is currently at 444 and there's decent short-term price support near 440. I expect to see the DJUSHV bounce from this level, but keep in mind that major price support resides down near 415 and if both the 444 and 440 support levels are lost, we could see a very quick drop down to test that level. Quanta Services (PWR) has the highest SCTR rank (93.4) in the industry group and could certainly benefit from a rebound in this space.
Historical Tendencies
Energy's best gains are typically made in the first four months of the year. I've provide the following chart before, but it's worth getting a refresher. Check it out:
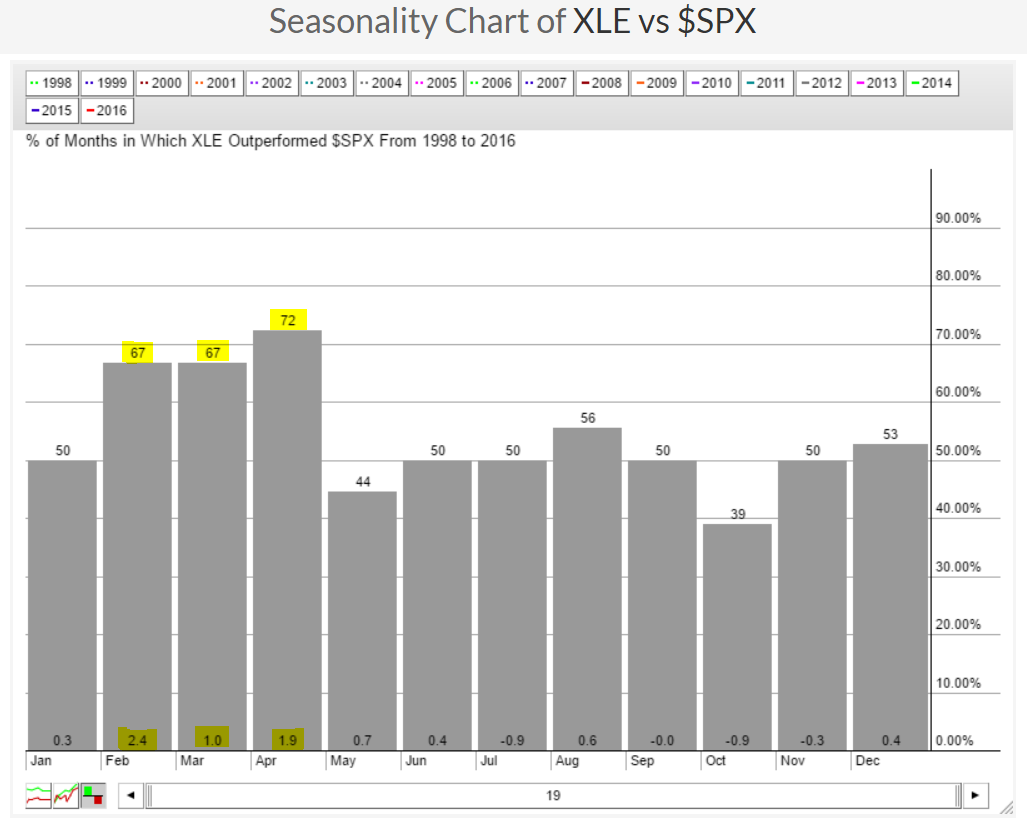 While January is just mediocre, the XLE enjoys crazy outperformance during February, March and April. Any further short-term weakness in the XLE represents a buying opportunity with perhaps a closing stop beneath 70 - all in my humble opinion of course.
Key Earnings Reports
(actual vs. estimate):
MSM: .95 vs .93
Key Economic Reports
None
Happy trading!
Tom


