Market Recap for Friday, January 20, 2017
Basic materials (XLB, +0.89%) led yet another U.S. stock market rally on Friday as the Dow Jones gained close to 100 points to once again approach what could become its first all-time closing high above 20000. After Friday's gain, the Dow Jones needs another 173 points, or less than 1%, to clear that milestone. Aiding that advance in the Dow Jones and, more specifically, the basic materials sector was specialty chemicals ($DJUSCX). The DJUSCX printed the right side of a cup as you can see below:
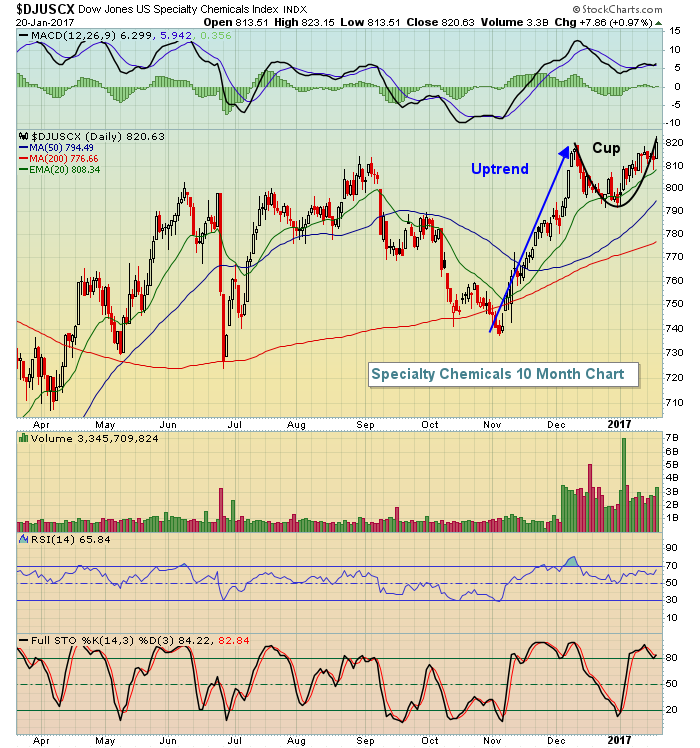 The prior uptrend is clearly highlighted by the blue directional line above. A cup with handle pattern is a continuation pattern of a prior trend. Not every advance is followed by a distinguishable continuation pattern, however, so the DJUSCX is certainly free to continue its Friday breakout and push higher. Just understand that a temporary pullback to test the rising 20 day EMA would complete a very bullish continuation pattern and a breakout would be measurable to approximately 850 - assuming the handle forms before the breakout to complete the pattern.
The healthcare sector (XLV, -0.26%) was the only sector to finish lower on Friday. Its recent failure occurred exactly at short-term price resistance with its short-term uptrend line now being challenged. Take a look:
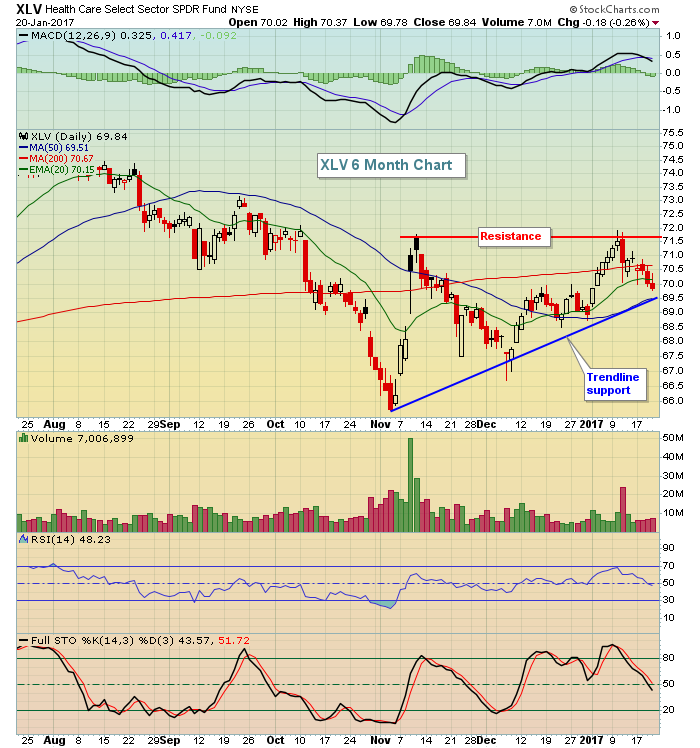 69.50 appears to be a fairly significant level for healthcare stocks as a close below that on the XLV would suggest a break of its uptrend line.
Pre-Market Action
Dow Jones futures are pointing to a slightly lower open to begin the week, currently 26 points with 30 minutes left to the opening bell. Asian and Europeans markets are mostly lower overnight and this morning. Crude oil ($WTIC) is also under pressure and U.S. futures are following suit.
Gold ($GOLD) is up about three quarters of one percent this morning at $1214. The key resistance level, in my view is closer to $1225. I doubt we'll see a close above that level near-term, but nothing is a certainty so we'll see.
Current Outlook
In mid-December I wrote about the possibility of the 10 year treasury yield ($TNX) falling back to test MACD centerline support and/or its rising 50 day SMA on the heels of a negative divergence that printed. It did just that, but once the momentum issue was resolved the TNX has regrouped and is now moving higher. A rising TNX indicates that treasuries are being sold - that inverse relationship always exists. The selling of treasuries produces proceeds that can be used to fuel a stock market rally. So I'm generally going to be bullish equities when the TNX is rising, especially when yields remain so low historically. Cheap money and an improving economy makes for easy credit for businesses to expand and profits to grow. Here's the current picture on the TNX:
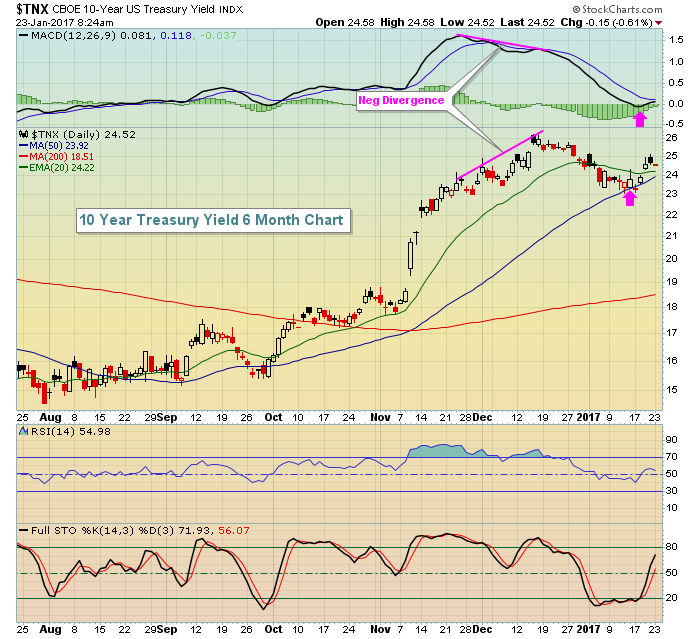 The pink arrows mark the end of the momentum issues. In other words, the slowing momentum from mid-December has been completely unwound as a MACD centerline test tells us that the short-term and longer-term exponential moving averages are exactly the same. There is no longer a momentum problem.
Sector/Industry Watch
Technology has been setting record after record recently, but not every industry group within the sector has done the same. On Friday, computer services ($DJUSDV) joined other strong technology industry groups with a breakout of its own. Perhaps this will kick start relative outperformance in the DJUSDV. Take a look at the breakout, but the relative weakness in computer services vs. their technology peers:
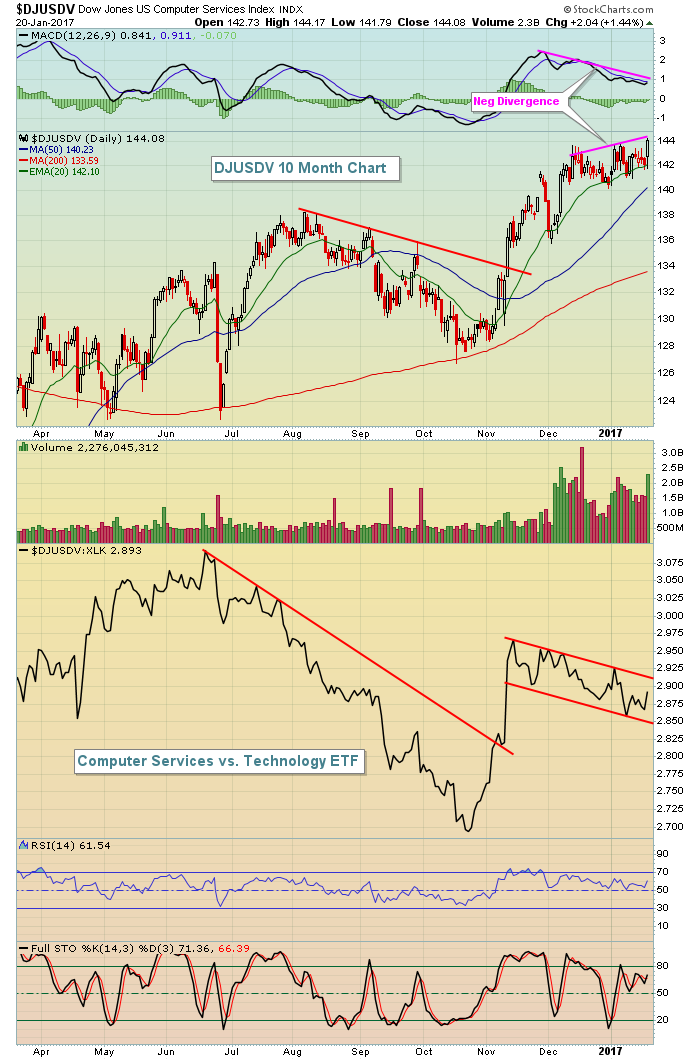 The price breakout on the DJUSDV is nice, but this has been an underperforming area in technology for the past 2-3 months despite its rise in absolute terms. There's also a negative divergence in play bringing into question whether momentum issues could slow the group as well. I'd feel better about the intermediate-term prospects with a relative breakout in the $DJUSDV:XLK ratio above.
Monday Setups
The basic premise in short-term stock market trading is to reduce risk while increasing potential reward. Therefore, chasing stocks is typically not a great idea. Instead, I prefer to wait on a pullback to key support levels. An example of that is Burlington Stores (BURL). Check this one out:
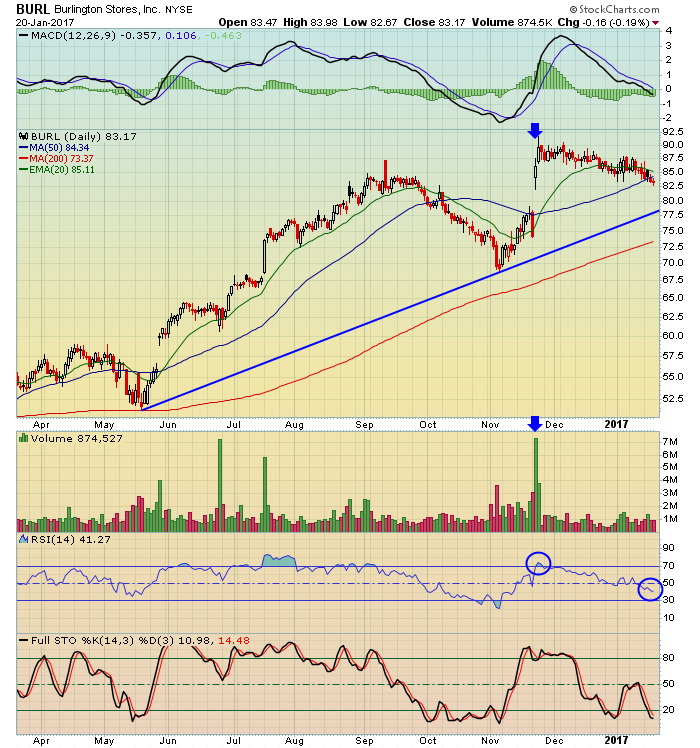 Take a look at the two blue circles on the RSI. After BURL's breakout on massive volume, it quickly became overbought. But after weeks of profit taking, BURL now has an RSI of 40, which is typically a level to consider entering during an uptrend. While we could see further selling in the stock near-term, I believe BURL's reward to risk has improved considerably over the past few weeks.
Historical Tendencies
I discussed the potential short-term issues on the DJUSDV above with momentum issues and relative weakness still present. The industry group also has historical performance issues this time of the calendar year. March, however, tends to be a very strong month for computer services. Therefore, if the momentum issue is resolved over the next few weeks, the DJUSDV could be set for another strong March. Here are the historical numbers over the past 17 years:
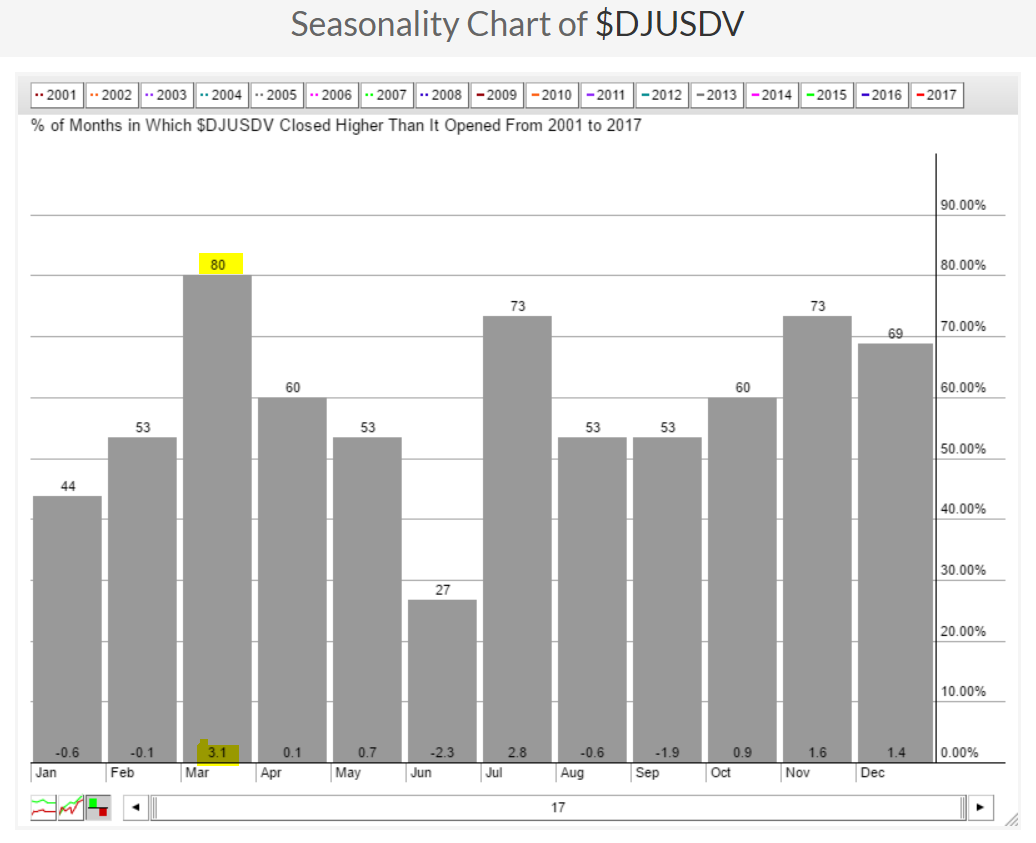 The only other calendar month that performs nearly as well as March is July. It'll be interesting to see if seasonality again proves true.
Key Earnings Reports
(actual vs. estimate):
HAL: .04 vs .02
MCD: 1.44 vs 1.41
(reports after close, estimate provided):
YHOO: .14
Key Economic Reports
None
Happy trading!
Tom


