Market Recap for Tuesday, January 24, 2017
The S&P 500 and NASDAQ both closed at new all-time highs on Tuesday as basic materials (XLB, +2.58%) soared. Freeport-McMoran (FCX) was huge performer in the group and FCX is featured below in the Sector/Industry Watch section. But other areas of materials did very well also. Take, for instance, the Dow Jones U.S. Commodity Chemicals Index ($DJUSCC), which gained 3.25% on the session. DuPont (DD) and Dow Chemical (DOW) led the charge in this space with both stocks breaking out. Here's a look at the current technical outlook for the index:
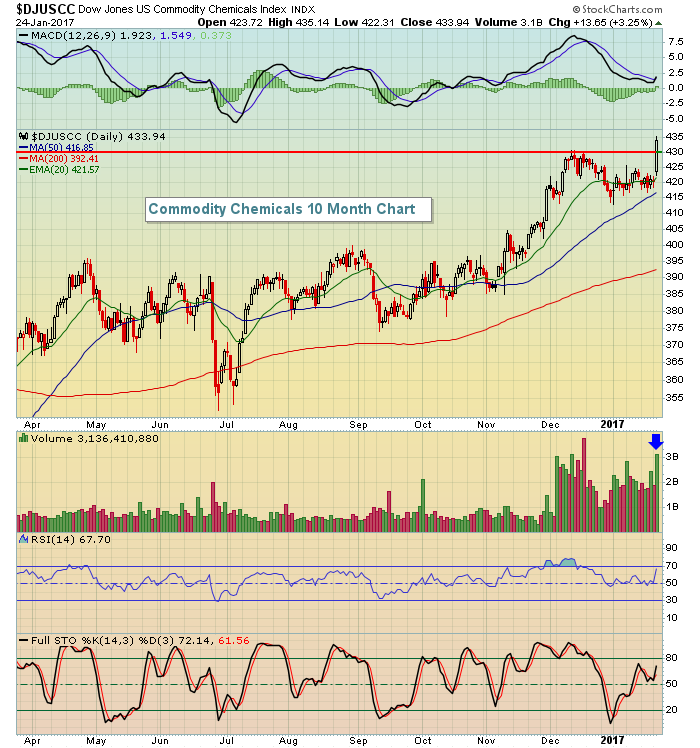 Volume was the highest we've seen in a month as the index finished at a new high. And the strength in those large cap names sent the Dow Jones back above 19900 as it once again challenges that psychological 20000 barrier. Will today be the day? It's difficult to say but strength overnight and higher U.S. futures this morning will provide traders yet one more opportunity.
Pre-Market Action
Asian markets and European markets have shown/are showing strength and that's aiding U.S. futures with Dow Jones futures currently higher by 100 points - possibly suggesting a break of the 20000 barrier at the open today. The Tokyo Nikkei ($NIKK) was higher by 1.43%, but the German DAX ($DAX) is topping that as it's currently higher by 1.64%. Of course, the S&P 500 and DAX tend to be very positively correlated so strength in Germany is likely to carry over today here in the U.S.
The 10 year treasury yield ($TNX) rose nearly 7 basis points on Tuesday and it's up another couple basis points this morning to 2.49%. We've seen a nice bounce off recent yield support at 2.30%. That negative divergence has been resolved in my opinion so I look for a test of yield resistance at 2.60% during this run. 2.30% to 2.60% is the short-term yield trading range.
Crude oil ($WTIC) is down fractionally below the $53 per barrel level this morning.
Current Outlook
There's been so much discussion about Dow 20000, but the weekly chart says it all. We had a parabolic rise in the Dow and we're now overbought with a likely 20 week EMA test ahead. The question is whether we see that 20 week test prior to breaking out. There's no guarantee, but the technical condtions remain very strong as you can see below:
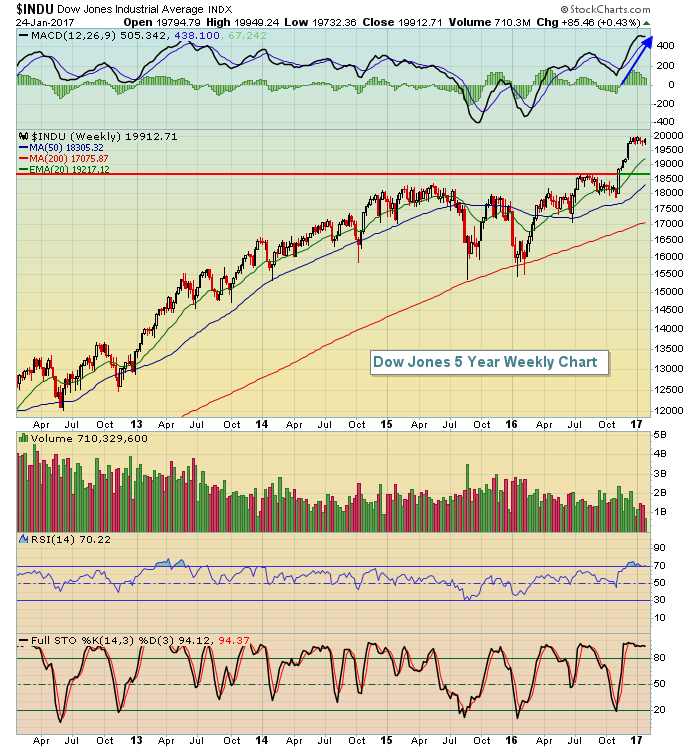 Notice that the weekly RSI and stochastic are at 70 and 94, respectively. That represents overbought territory so if 20000 resistance continues to hold, just understand that consolidation and a bit more profit taking down to the rising 20 week EMA would not be a bearish signal at all. We'll likely see another battle at 20000, however, as the demand for global equities continues.
Sector/Industry Watch
Freeport-McMoran (FCX) essentially is the Dow Jones U.S. Nonferrous Metals index ($DJUSNF) and there's a ton of bullishness in the short-, intermediate- and long-term patterns. First, check out the daily chart where FCX broke out of a bullish inverse head & shoulders continuation pattern:
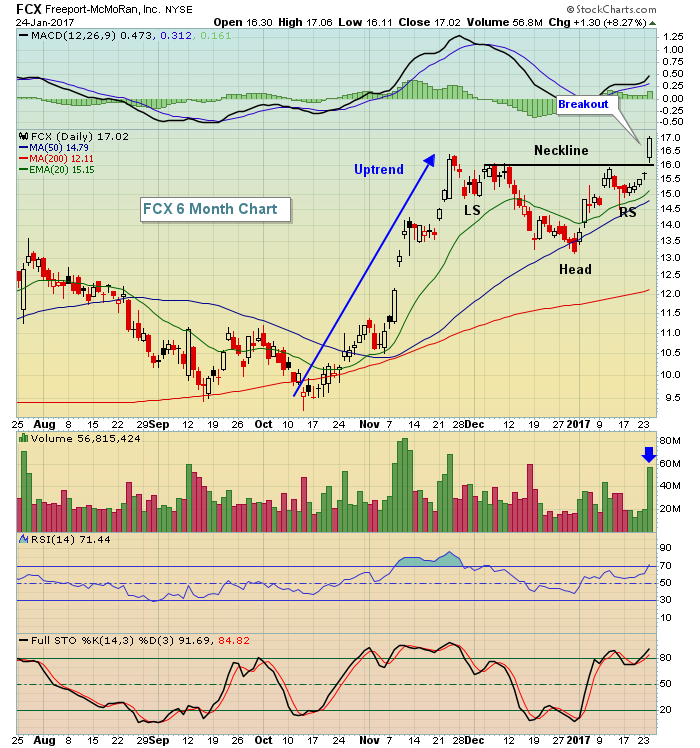 The breakout yesterday occurred on excellent volume and that's required to confirm the bullish pattern. Furthermore, the weekly chart showed not that long ago a breakout of a bottoming reverse head & shoulders pattern. Check this out:
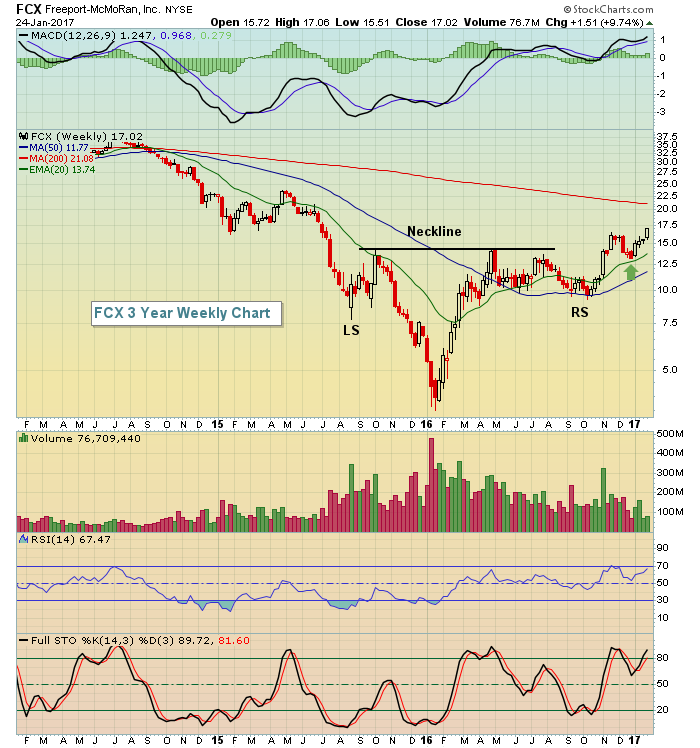 A very significant test of this reverse head & shoulders breakout occurred on the recent pullback to its rising 20 week EMA. FCX appears poised to rise further based on these bullish patterns.
Now for the bad news. FCX reported its latest quarterly results this morning and came up well short. Given the technical outlook, however, I believe a test of inverse head & shoulder neckline support near 16.00 would be a solid buying opportunity. That neckline, along with the rising 20 day EMA, are the two best entry options in my opinion.
Historical Tendencies
Since 1971, the odds of the NASDAQ moving higher on any each week day is as follows (annualized returns for each week day are in parenthesis):
Monday: 46.6% (-32%)
Tuesday: 51.0% (-3%)
Wednesday: 60.5% (+28%)
Thursday: 60.1% (+26%)
Friday: 60.8% (+26%)
The NASDAQ has the tendency to make bullish moves from Wednesday through Friday.
Key Earnings Reports
(actual vs. estimate):
ABT: .65 vs .64
APH: .75 vs .72
BA: 2.47 vs 2.34
FCX: .25 vs .32
GWW: 2.45 vs 2.36
HBAN: .24 vs .22
HES: (1.01) vs (1.09)
ITW: 1.39 vs 1.37
MKC: 1.27 vs 1.27
NSC: 1.42 vs 1.38
NVS: 1.12 vs 1.09
PGR: vs .51 (hasn't reported yet)
ROK: 1.75 vs 1.45
STT: 1.48 vs 1.34
TEL: 1.15 vs 1.00
TXT: .80 vs .87
UTX: 1.56 vs 1.56
(reports after close, estimate provided):
CCI: 1.11
CTXS: 1.26
EBAY: .47
FFIV: 1.53
LRCX: 2.19
LVS: .65
MCK: 2.95
QCOM: 1.06
SLG: 1.44
T: .66
URI: 2.30
VAR: 1.05
VRTX: .01
WDC: 1.65
WIT: .13
XLNX: .49
Key Economic Reports
November FHFA house price index to be released at 9:00am EST: +0.5% (estimate)
Happy trading!
Tom


