Market Recap for Thursday, February 23, 2017
The action on Thursday was not bullish at all. Yes, the Dow Jones and S&P 500 rose again with the Dow setting another all-time high. Great action, right? Wrong. The more aggressive NASDAQ and Russell 2000 both fell again by .43% and .66%, respectively, and that's unfortunately been the pattern of late. The stock market moving higher - or attempting to move higher - with leadership coming from defense.
Sector performance on Thursday was no better. Utilities (XLU, +1.03%) and healthcare (XLV, +0.73%), two defensive sectors, led the action with the aggressive consumer discretionary (XLY, -0.68%) and industrials (XLI, -0.65%) lagging. Technology (XLK, -0.02%) and financials (XLF, +0.00%) both ended the session near the flat line. Bottom line? Aggressive areas of the market have lost their zest, at least temporarily. That, in part, is why the market is down in pre-market action. Money is rotating to defense in preparation for a bit of profit taking. Will it be worse than simple profit taking? I'm not sure but it'll be interesting to watch the action the next couple weeks.
Pre-Market Action
Overnight losses in Asia began the global selling and its continued this morning in Europe as the German DAX is down 200 points, or 1.69%. We have a couple of key economic reports due out at 10am EST here as both new home sales and consumer sentiment will be released. Honestly, though, I don't think those reports will matter much. We're in dire need of some profit taking and momentum issues and rotation to defense suggests it's about to happen.
Dow Jones futures are lower by 83 points as crude oil prices are down slightly more than 1%. The 10 year treasury yield ($TNX) is nearing its key 2.30% support as well. It's just not going to be a great start to the day and I'd expect further selling later in the session.
Current Outlook
Don't be surprised by the futures this morning, which are lower. Our major indices are all very overbought and have been for awhile, we're in the time of the calendar month (19th to 25th) that has historically been the weakest part of nearly all calendar months for the past several decades, and there are short-term hourly negative divergences flashing all over the market - a signal of slowing bullish momentum. Yesterday, I posted the transportation index ($TRAN) and its 60 minute momentum struggles. Below is the S&P 500:
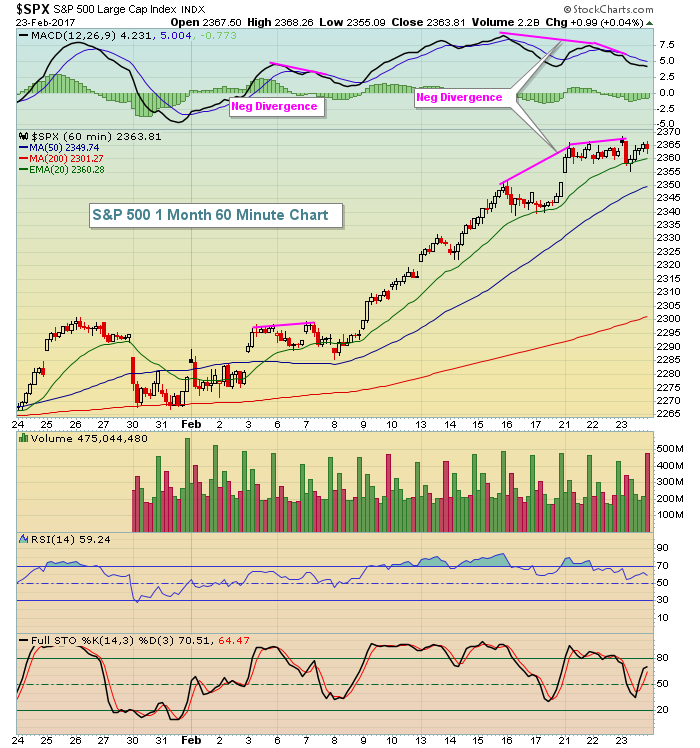 I didn't highlight it above, but check out the hourly RSI and how it's been so overbought the past 10 days or so. Throw in those negative divergences and the U.S. market is poised for some profit taking and relief. So don't be shocked. The one underlying problem is that this latest push higher has been led by defensive areas. Therefore, I'm very interested to see how the next rally unfolds. Do we see another rally led by defense? If so and negative divergences begin to form on the daily charts, there could be a deeper selling episode. But let's just watch it from day to day for now and make necessary trading adjustments as appropriate. In the very near-term, watch price support on the S&P 500 from 2340 (recent price lows) to 2350 (gap support).
Sector/Industry Watch
The Dow Jones U.S. Tires Index ($DJUSTR) recently broke out of an inverse head & shoulders pattern so any pullback to test the rising 20 day EMA and/or neckline support would represent solid reward to risk entry into this space. Here's the chart:
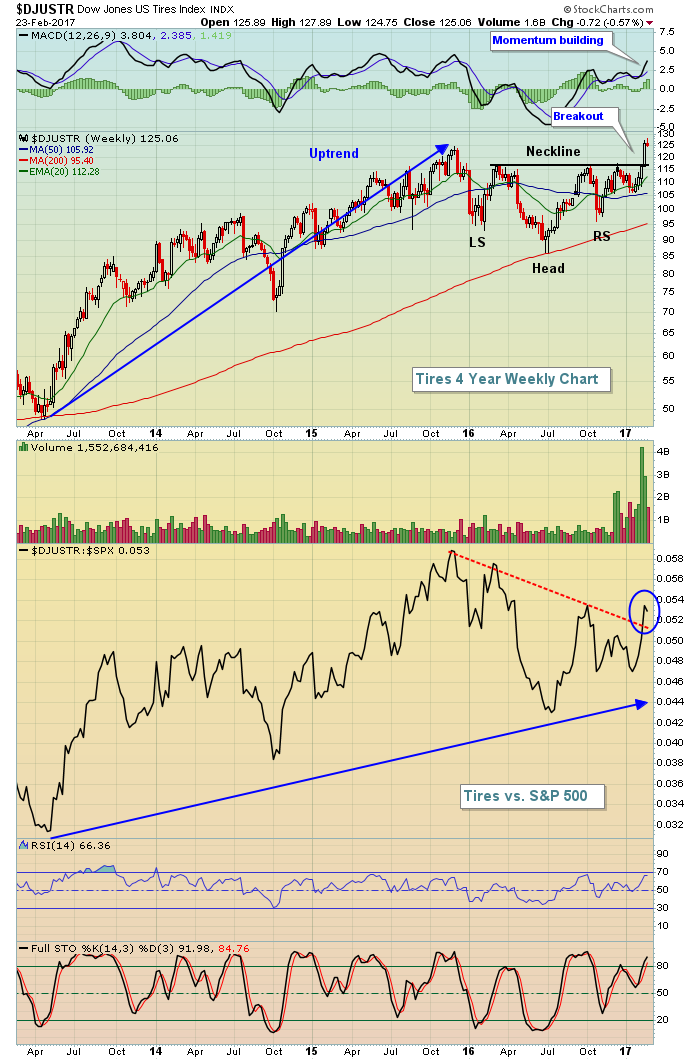 Do you see how tires underperformed the S&P 500 for a year while this bullish continuation pattern developed? If you remain in stocks going through such a consolidation phase, it gets very frustrating and discouraging - especially for a short- to intermediate-term trader. Why? Because your money does nothing - or potentially loses ground - while the overall market moves higher. As a trader, you need to be successful at catching these shifts and periods of rotation. Tires now have broken out of a bullish pattern and also broke their relative downtrend line. I expect tires to perform very well in 2017.
Historical Tendencies
I pair technical outlooks and historical tendencies much like you might foods and wines. Some go together well and some don't. Just above, I highlighted the bullish technical outlook for tires. Below is the historical tendency of this group:
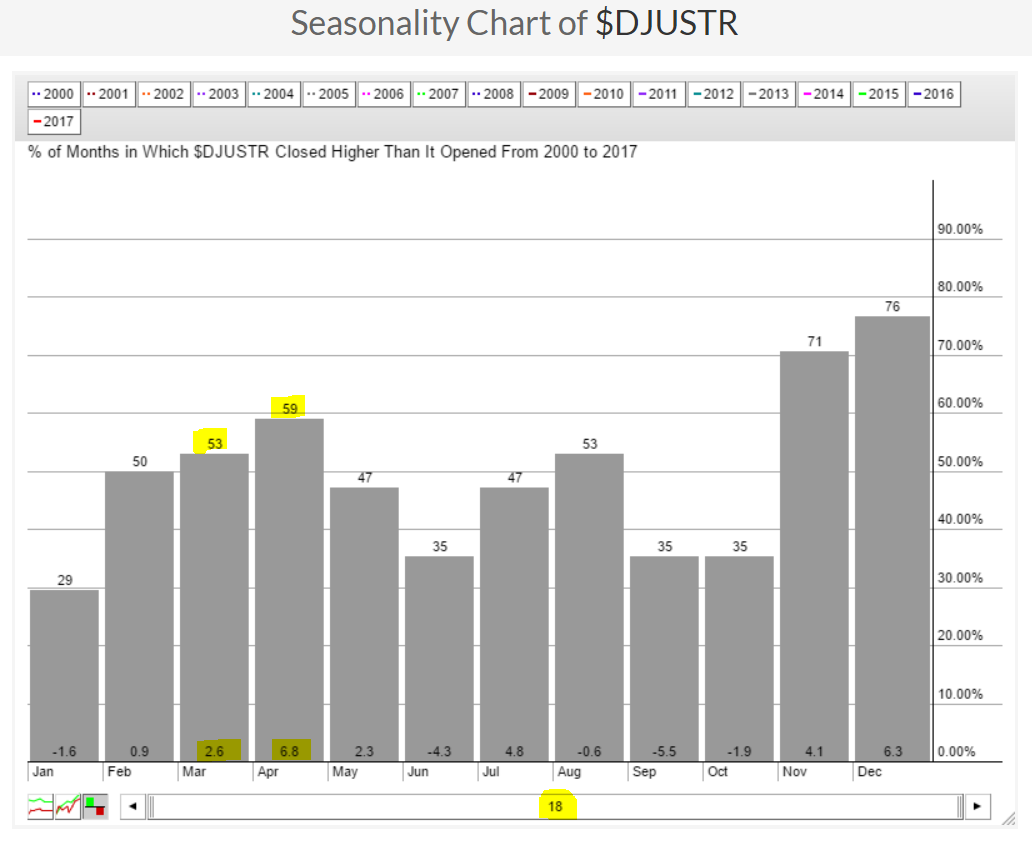 November and December rank as the best consecutive calendar months for tire stocks. But March and April are a very close second. Knowing that tires perform well during the upcoming two months and also knowing that the index has just broken out on an absolute and relative basis provides me more confidence in trading the group.
Key Earnings Reports
(actual vs. estimate):
COG: .01 vs .01
FL: 1.37 vs 1.31
MGA: 1.24 vs 1.35
PEG: .54 vs .52
RY: 1.40 vs 1.33
Key Economic Reports
January new home sales to be released at 10:00am EST: 576,000 (estimate)
February consumer sentiment to be released at 10:00am EST: 96.0 (estimate)
Happy trading!
Tom


