Market Recap for Monday, March 27, 2017
It was yet another bifurcated day in the market with the Dow Jones losing ground for the eighth straight session and the S&P 500 joining the Dow in negative territory. For the second consecutive session, the NASDAQ and Russell 2000 bucked the selling and finished in positive fashion. Healthcare (XLV, +0.27%) led to the upside as biotechnology ($DJUSBT) nearly tested its rising 20 week EMA before bouncing - great action. Check out the biotechs:
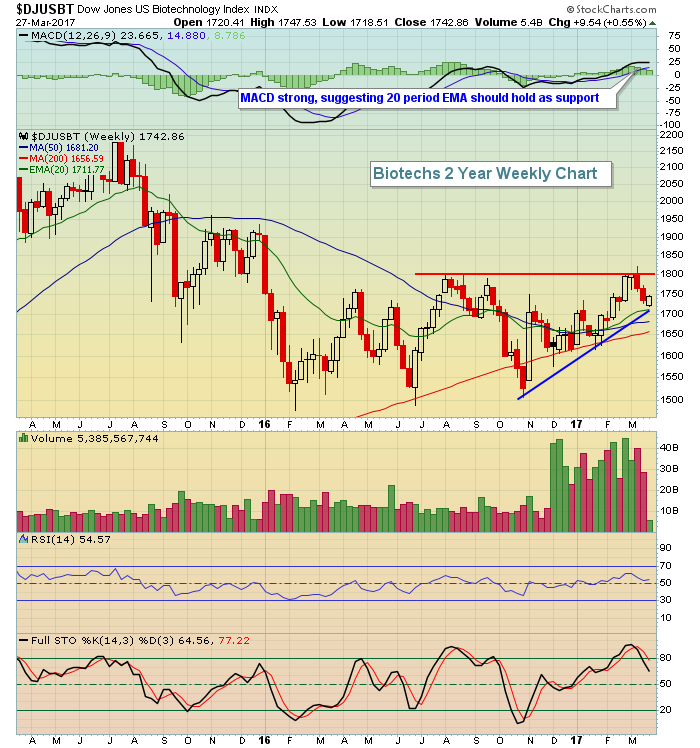 Note that the recent trendline nearly intersects the 20 week EMA. I'd be nervous on a weekly close beneath 1700 and I'd be very bullish on the next weekly close above 1800 so the group, for now, is simply consolidating.
Energy (XLE, -0.47%) was the weakest link on Monday. A steady four month decline in the Dow Jones U.S. Integrated Oil & Gas Index ($DJUSOL) has that industry at quite significant support as you can see on the following chart:
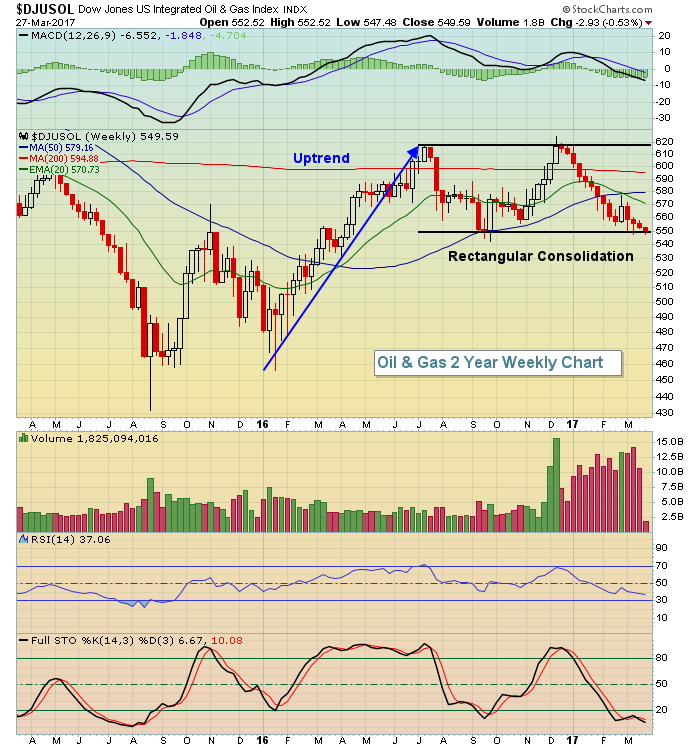 Energy has easily been the worst performing sector in 2017 so we can't take the above support test on the DJUSOL lightly. Another breakdown here would not bode well for the sector as a whole.
Pre-Market Action
Dow Jones futures this morning are pointing to the possibility of a 9th consecutive losing session as they're down 26 points with just a little more than 30 minutes to the opening bell. Global markets are mixed as the Tokyo Nikkei ($NIKK) continues to consolidate in a fairly narrow range from 18700-19600.
Current Outlook
The Dow Jones has been under selling pressure since the opening trading day in March, but honestly it's done nothing damaging to its chart technically. In fact, the selling has relieved very overbought conditions with its RSI falling from the mid-80s down to 40 at Monday's close. During uptrends, RSI 40 support tends to be very strong so entry into the Dow Jones (DIA is the ETF that tracks the Dow Jones) at this level after a fairly significant decline makes sense to me. Here's how the DIA chart looks:
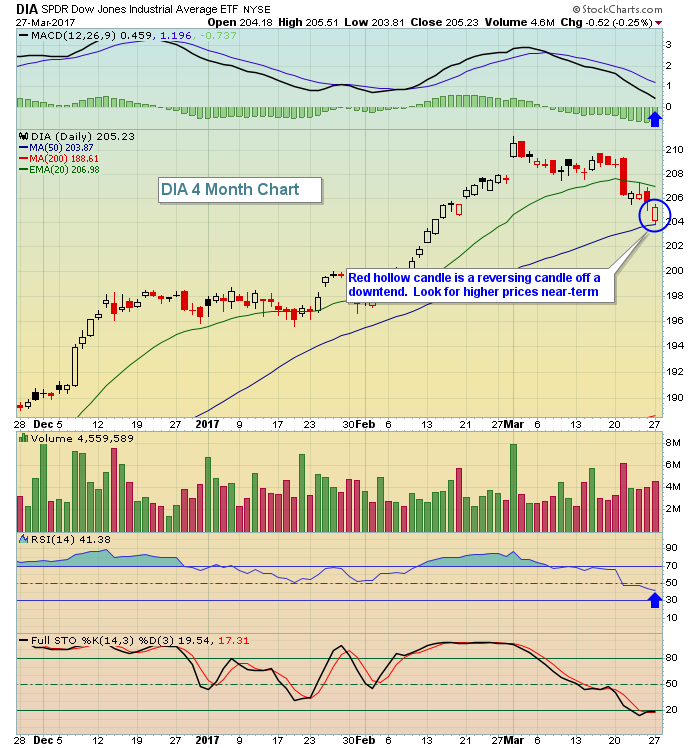 The blue arrows above show the approaching MACD centerline test and the RSI reaching that 40 level. Again, I'd look for a rebound from here.
Sector/Industry Watch
The Dow Jones U.S. Industrial Suppliers Index ($DJUSDS) became overbought on its long-term weekly chart in January and was in need of a pullback to test its rising 20 week EMA. This appears to be the week it's occurring - check it out:
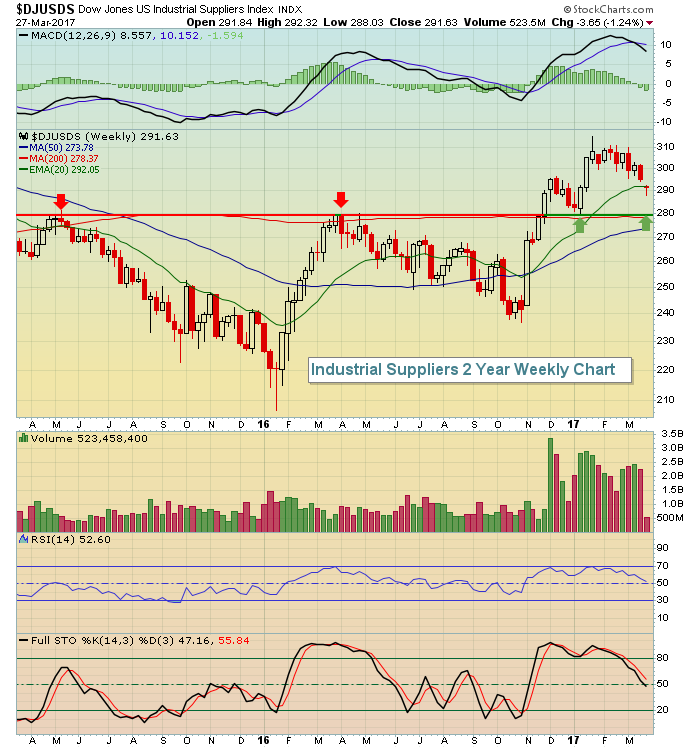 In addition to the rising 20 week EMA, price support at 280 is very solid as well.
Historical Tendencies
Alliance Data Systems (ADS) is one of the best performing S&P 500 companies during March and April. Below is a seasonal chart that highlights this strength:
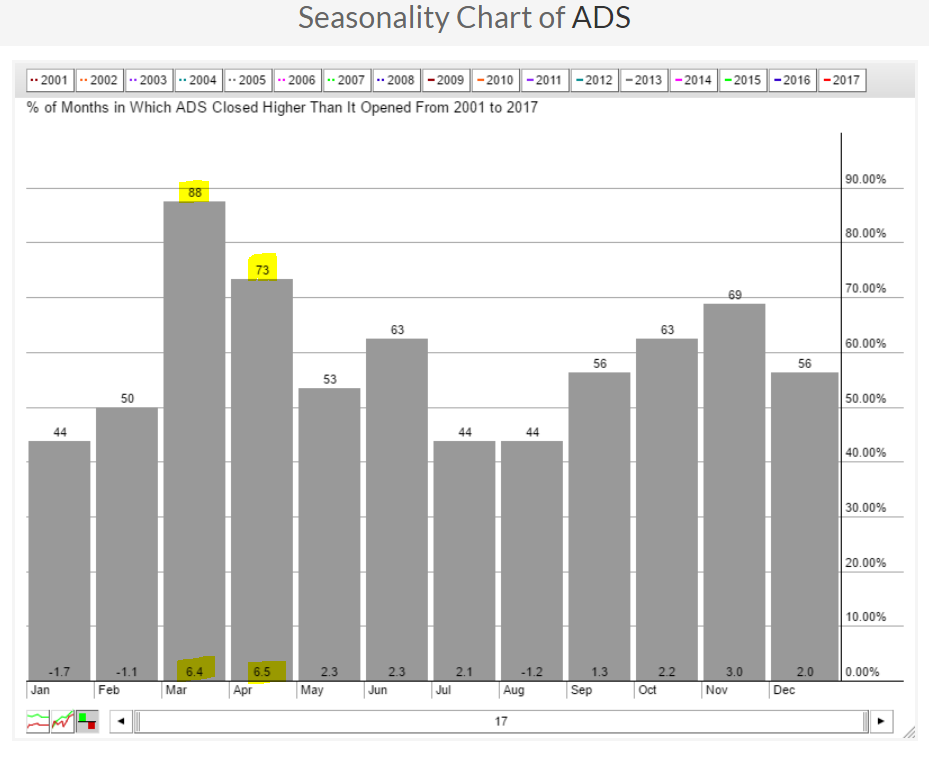 Technically, ADS appears strong as well. Yesterday, it had a test of key price support at 240 before bouncing into the close. May, June and July also post solid results so I'd look for the recent technical strength to continue.
Key Earnings Reports
(actual vs. estimate):
CCL: vs .35 (have not seen actual EPS yet)
DRI: 1.32 vs 1.27
FDS: 1.81 vs 1.80
INFO: .34 vs .37
MKC: .76 vs .75
Key Economic Reports
January S&P Case Shiller HPI to be released at 9:00am EST: +0.8% (estimate)
March consumer confidence to be released at 10:00am EST: 113.8 (estimate)
Happy trading!
Tom


