Market Recap for Monday, March 6, 2017
U.S. equities experienced a little profit taking on Monday, nothing technically damaging, but all our major indices did finish lower. The only sector to escape damage was energy (XLE, +0.22%), while all the others declined. On a relative basis, the XLE neared a major support level and now is attempting to change relative directions and perhaps lead the benchmark S&P 500 for a bit. Below is the XLE:$SPX relative ratio:
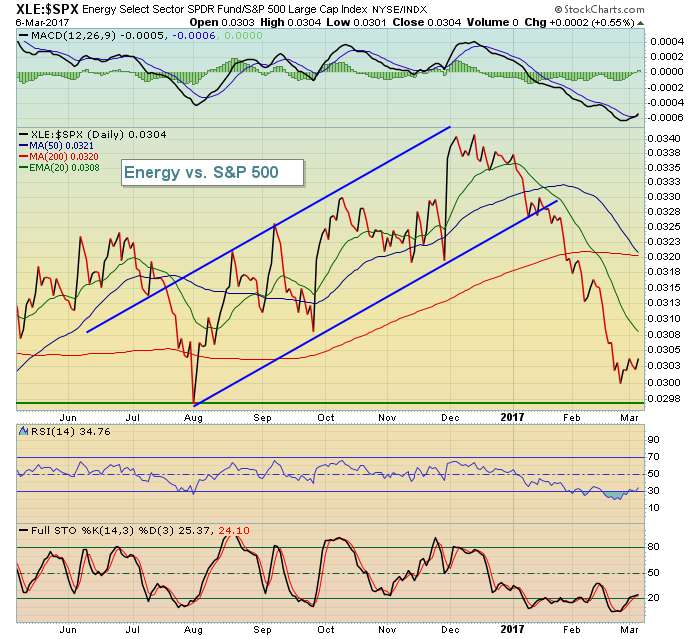 Clearly, energy has not been the sector of choice for the past three months as the group has been shunned. There is a silver lining, however, as the price action has held up on a technical basis. The uptrend remains intact, but the XLE needs to begin performing well to keep the absolute price action technically sound. Here's a look at the technical picture:
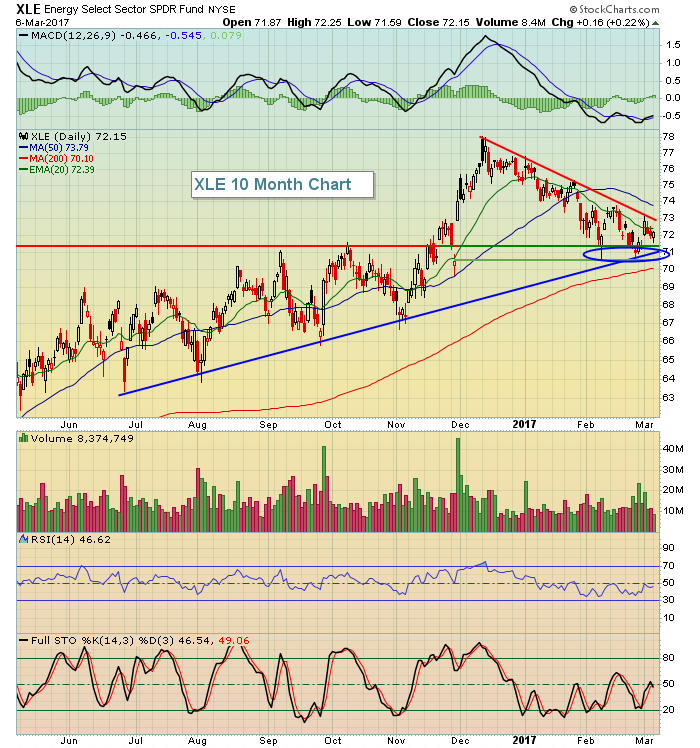 From the above, there's a very strong range of price, trendline and gap support in the 70.50-71.50 area. It's fairly critical from a technical perspective that the XLE turn here and it appears to be trying to do just that. In addition, I've discussed multiple times that energy has performed very bullishly during the months of March and April.
Pre-Market Action
Asian markets were mostly higher overnight and European markets are hovering close to the flat line. That's left U.S. equities fairly close to breakeven as well, although they're down slightly. With 30 minutes left to the opening bell, Dow Jones futures are down 28 points, continuing Monday's tepid selloff.
Gold ($GOLD) is down another 5 bucks this morning and that comes on the heels of consecutive closes beneath its 20 day EMA. The only chart that looked bullish to me on gold was the short-term uptrend off the mid-December low. Given the accelerating daily momentum (MACD), I felt it was very important for the rising 20 day EMA to hold. I'd be very careful holding here as the longer-term downtrend could be resuming with this short-term technical failure.
Crude oil ($WTIC) is up approximately 0.75% this morning, which could aid the energy sector again today.
Current Outlook
The recent strength in healthcare (XLV) has enabled that sector to break out on a relative basis vs. the benchmark S&P 500, which suggests that we favor this group in our trading - at least until this condition changes. Take a look at the recent relative strength and the break of the relative downtrend line:
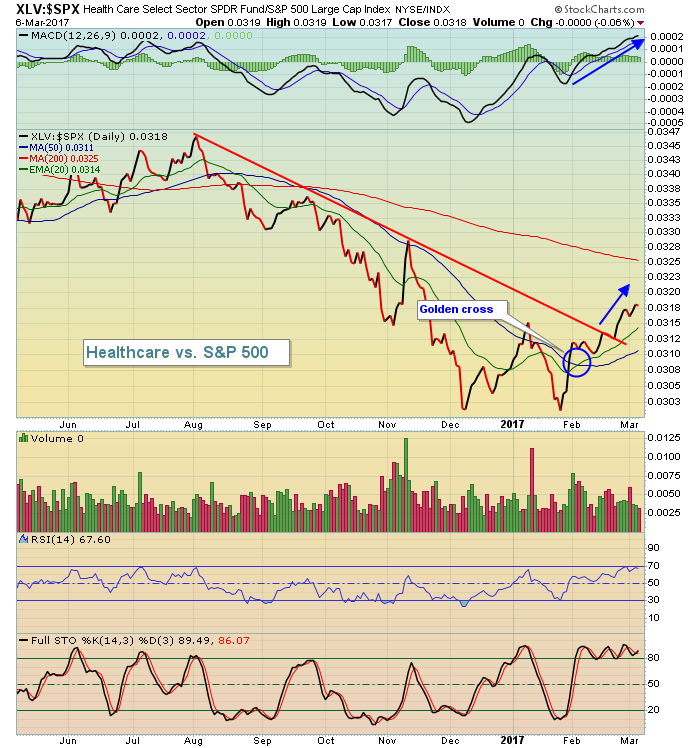 Over the past month, the XLV has been the best performing sector ETF and this outperformance seems to have just begun. Note how the 20 day EMA remained below the 50 day SMA during the period of relative weakness? Well, that relationship has changed with the golden cross. So long as the 20 day EMA remains above the 50 day SMA, I'd look for continuing relative performance.
Sector/Industry Watch
The Dow Jones U.S. Industrial Suppliers Index ($DJUSDS) has been consolidating, but remains in a very bullish pattern as it awaits its next breakout. It was the best performing industry group yesterday within the industrials sector (XLI) and stocks within this space should be considered for trading. Check out the DJUSDS:
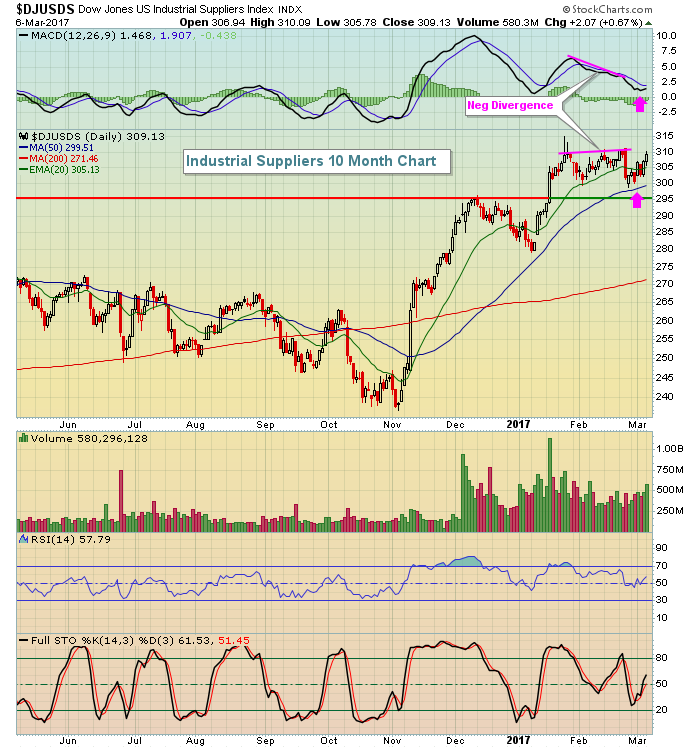 There was a slight negative divergence so a 50 day SMA test isn't out of the question. That's currently at 299 and price support resides at 295 so that's the range of support to watch to the downside.
Historical Tendencies
The losses that we saw across our major indices yesterday shouldn't be a surprise. Since 1950 on the S&P 500, Mondays have been by far the worst performing calendar day of the week. Mondays move higher well below 50% of the time (as opposed to 55% or higher for Wednesdays through Fridays) and their average annualized return over the past 66 years is -15%. Yesterday was typical action.
Key Earnings Reports
(actual vs. estimate):
AZO: 8.08 vs 8.20
DKS: 1.32 vs 1.30
MIDD: 1.41 vs 1.27
(reports after close, estimate provided):
HRB: (.46)
URBN: .56
Key Economic Reports
None
Happy trading!
Tom


