Market Recap for Friday, March 10, 2017
U.S. equities posted mostly strong results on Friday with a bit of relative strength from the more aggressive NASDAQ and Russell 2000. The NASDAQ 100 ($NDX) posted the best percentage gain of all, but keep in mind that the NDX does not include financial stocks and that area suffered from the 10 year treasury yield's ($TNX) inability to break above key yield resistance at 2.62%. Take a look at the TNX:
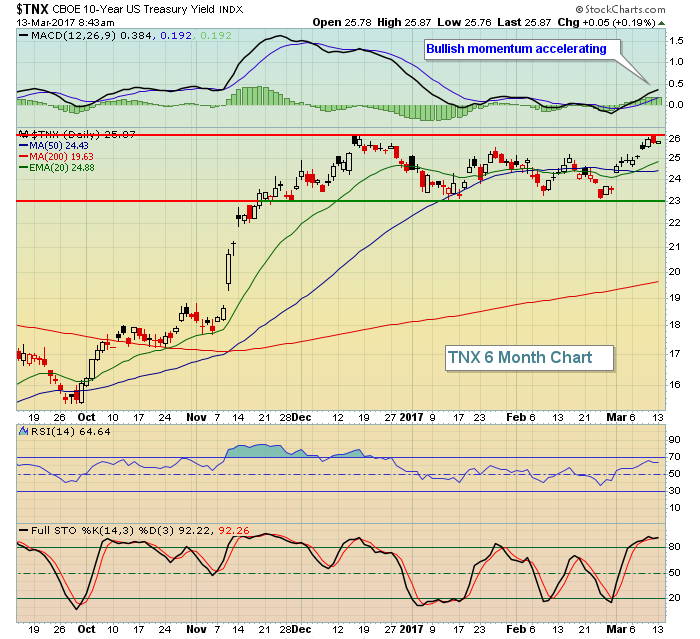 The fact that the TNX touched resistance last week, but failed to break through hurt areas of finance like banks ($DJUSBK). Banks do remain technically sound, however, so I look at this failure to be temporary. The FOMC announcement comes on Wednesday afternoon. While the quarter point rate hike is likely already baked into the TNX, further hawkish discussion on Wednesday could be the catalyst for a TNX breakout above 2.62%.
Leading the action on Friday from a sector perspective was utilities (XLU, +0.83%). The XLU benefited from the failure in the TNX to break out. However, the short-term strength in the XLU will likely be reversed with a TNX breakout. Industrials (XLI, +0.61%) also performed well as heavy construction ($DJUSHV) performed well as it hit key price and moving average support. The DJUSHV is featured below in the Sector/Industry Watch section.
Pre-Market Action
Intel (INTC) announced a $15 billion acquisition this morning of Mobileye (MBLY), which may provide a lift to the NASDAQ, although futures are mostly flat this morning.
Asian stocks were up overnight, led by a 1.11% gain in the Hang Seng Index ($HSI). European stocks are also higher, but those gains are fractional. The strength overseas has led to Dow Jones futures being slightly higher this morning - up 21 points with a little more than 30 minutes left before the opening bell.
Crude oil ($WTIC) is down again this morning, likely providing headwinds to the energy space (XLE) today.
Current Outlook
The Dow Jones has been weak of late, but much of it has been nothing more than filling the gap from March 1st. A close below 20800 could be potentially damaging in the near-term. However, if 20800 holds and we see another breakout in the Dow, all bets are off for more short-term selling. Here's the hourly chart on the Dow:
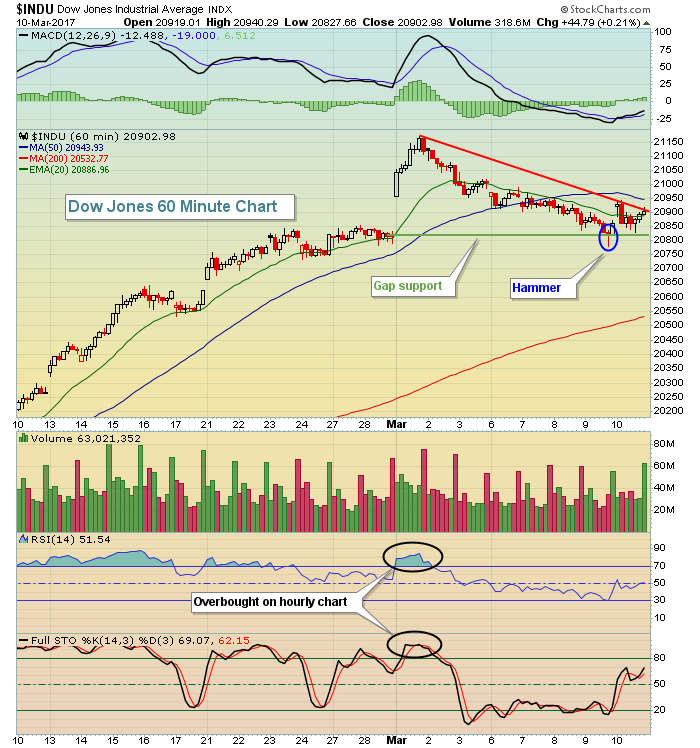 The Dow Jones was overbought on a very short-term basis and needed the selling to fill the gap. The 60 minute chart now appears to be poised for another potential rally.
Sector/Industry Watch
Money has been rotating away from heavy construction ($DJUSHV) in recent weeks, but the selloff/consolidation has been of huge benefit technically as the index is now resting on price and 20 week EMA support. Check it out:
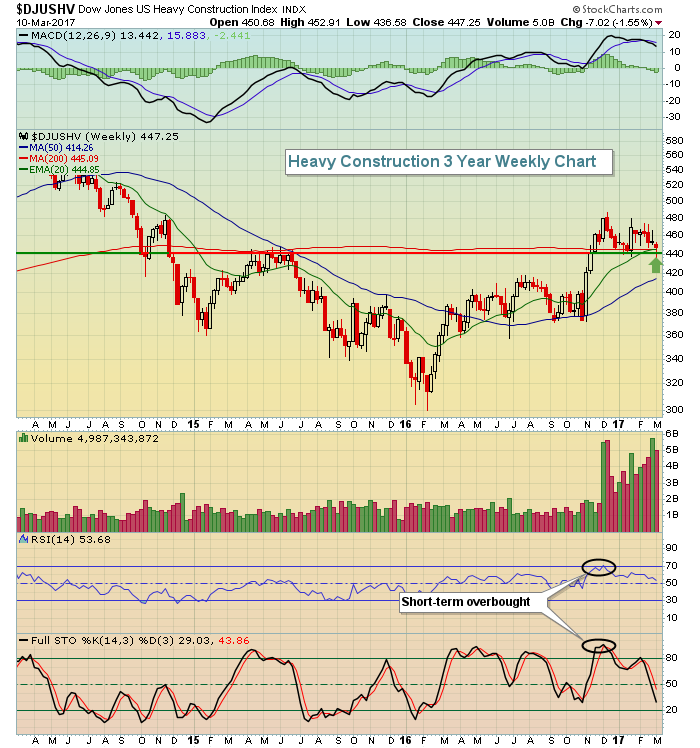 The consolidation has helped as the overbought RSI and stochastic have been alleviated. I'd look for a bounce at this level and given the bullish reward to risk, I posted a Don't Ignore This Chart blog article yesterday on a stock in this space that could benefit. You can CLICK HERE to review that article.
Monday Setups
Myriad Genetics (MYGN) is attempting to break its severe downtrend that began in late 2015. Since that time, MYGN had lost two thirds of its market capitalization just prior to its recent rally. The rally has been strong and with increased volume, however, so it appears this could be a run that is sustained for awhile. The MACD has turned positive on the daily chart for the first time since April of last year. 19.82 was the recent price high and the rising 20 day EMA now sits at 18.57. That's the trading range for now. Should MYGN fall a bit further, the reward to risk will turn much more in the favor of being long. Here's the chart:
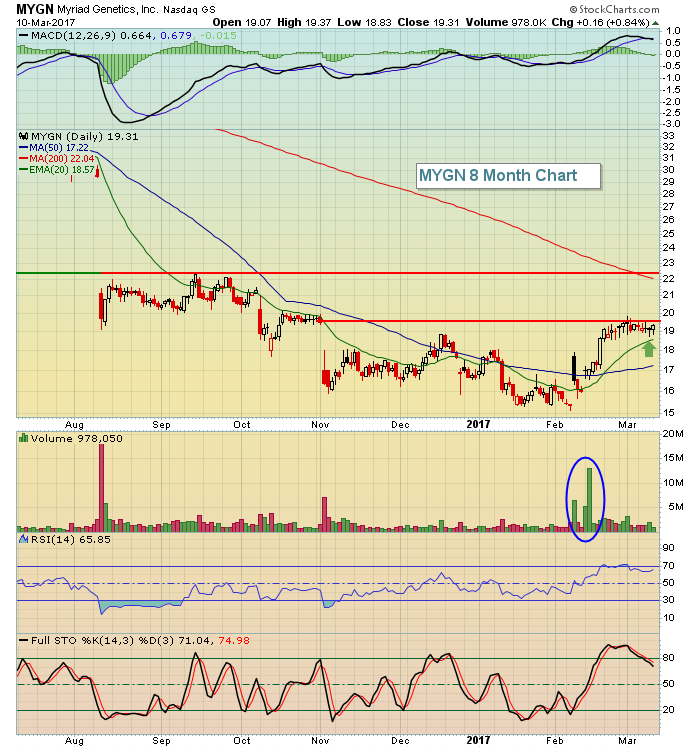 The weekly chart has also turned more bullish with a price move above the declining 20 week EMA for the first time since April 2016. Recent weakness has held the now-rising 20 week EMA. Therefore, the two key support levels are the rising 20 period EMAs - the daily 20 EMA at 18.57 is the first critical support while the 20 week EMA at 18.56 (one penny lower) is the longer-term support. I would not want to see MYGN close a week below both.
Historical Tendencies
We have now moved into a much more bullish period for U.S. equities. The S&P 500 has a tendency to move higher from the 1th to the 18th of most calendar months. In fact, here are the annualized returns for each of these days (not just in March, but all calendar months):
11th: +11.58%
12th: +10.03%
13th: +9.21%
14th: +4.96%
15th: +9.01%
16th: +33.79%
17th: +14.55%
18th: +17.06%
The S&P 500 has average annualized returns of approximately 9% since 1950 so the returns above really begin to improve near mid-month.
Key Earnings Reports
None
Key Economic Reports
None
Happy trading!
Tom


