Market Recap for Tuesday, April 25, 2017
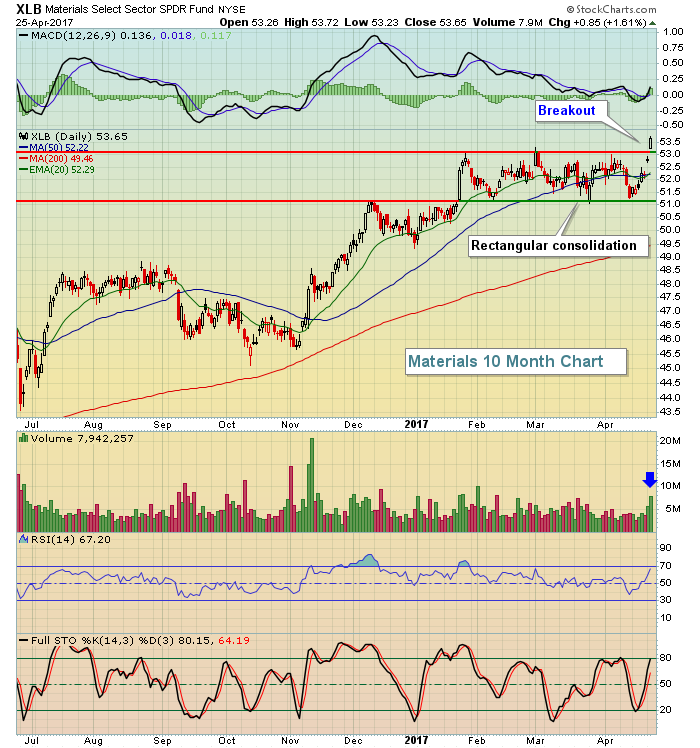
U.S. indices closed significantly higher for a second consecutive session, this time with materials (XLB, +1.61%) leading eight of the nine sectors higher. Only utilities (XLU, -0.13%) failed to gain on the session. We are seeing breakouts one at a time across our major indices, sectors and industry groups. Many of the areas breaking out consolidated in bullish fashion for weeks or months prior to breaking out. One such sector is the materials space where the XLB finally cleared resistance as you can see below:
 Commodity chemical stocks ($DJUSCC) were one of the reasons why the XLB broke out and this industry group is featured below in the Sector/Industry Watch section.
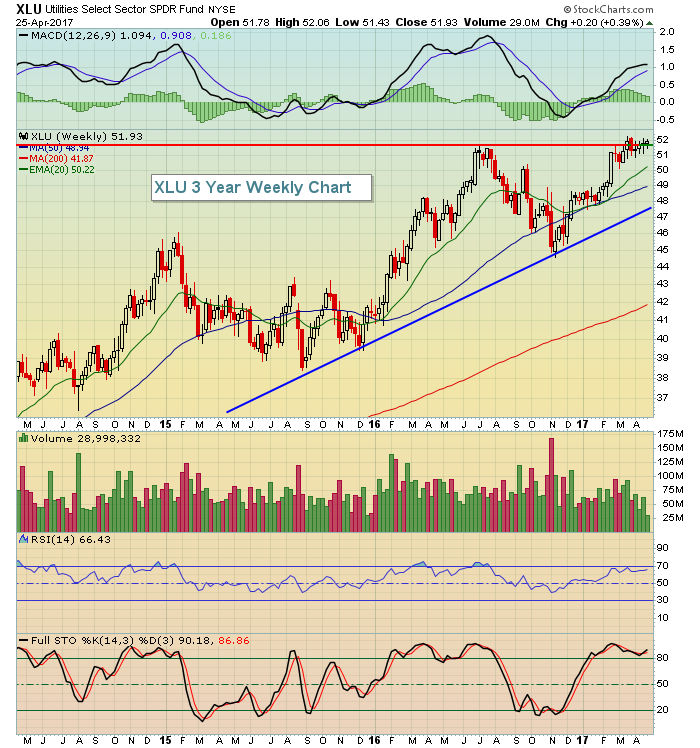
Utilities lagged badly for a second consecutive session. There are two primary reasons for it. First, this sector is very defensive in nature and defensive stocks are not performing nearly as well as the aggressive stocks. Second, utilities have hit key price resistance and have stalled as a result. Take a look:
 Technically, the XLU did clear the summer 2016 price high, but it's been a challenge.
Pre-Market Action
Overnight, we saw further strength in Asia with the Tokyo Nikkei ($NIKK) up more than 1%, but Europe is mostly flat.
The 10 year treasury yield ($TNX) has climbed back above 2.30%, a good technical sign for a further push higher in yields. That bodes well for financials, which have once again been outperforming the S&P 500. So long as yield continue to rise, I'd look for additional relative strength from financials.
With 30 minutes to go until the opening bell, traders are deciphering a plethora of earnings reports with the Dow Jones futures up 12 points.
Current Outlook
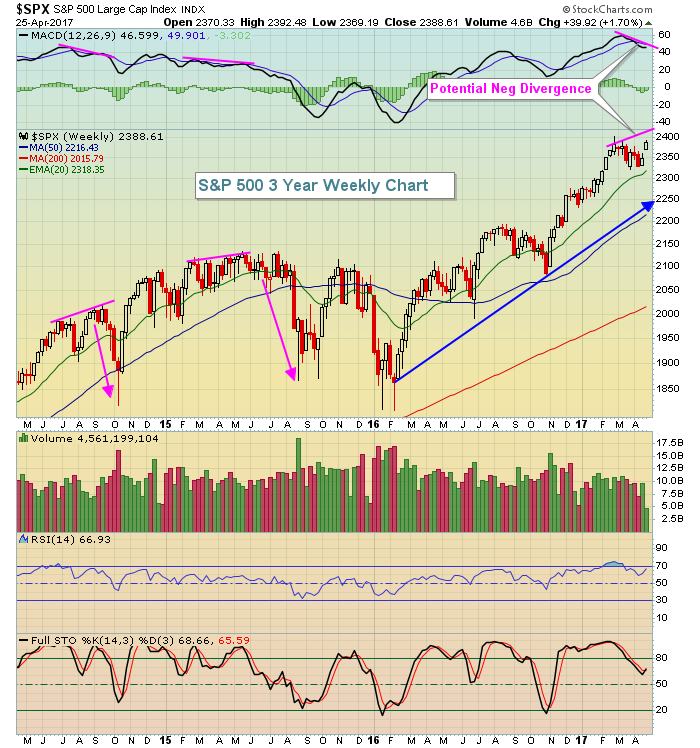
I expect the S&P 500 will break out and follow the NASDAQ's lead. When that happens, we do need to be aware of a negative divergence that's likely to take place on the S&P 500's weekly chart. That doesn't mean immediate weakness, but it could lead to further consolidation later this summer. Here's the current view:
 Negative divergences on weekly charts are a big deal as you can see from previous weekly negative divergences. There's always the chance that prices continue rising and the negative divergence is eventually eliminated but that will require weeks of strength and we have the summer period ahead - a time when the stock market tends to struggle.
Sector/Industry Watch
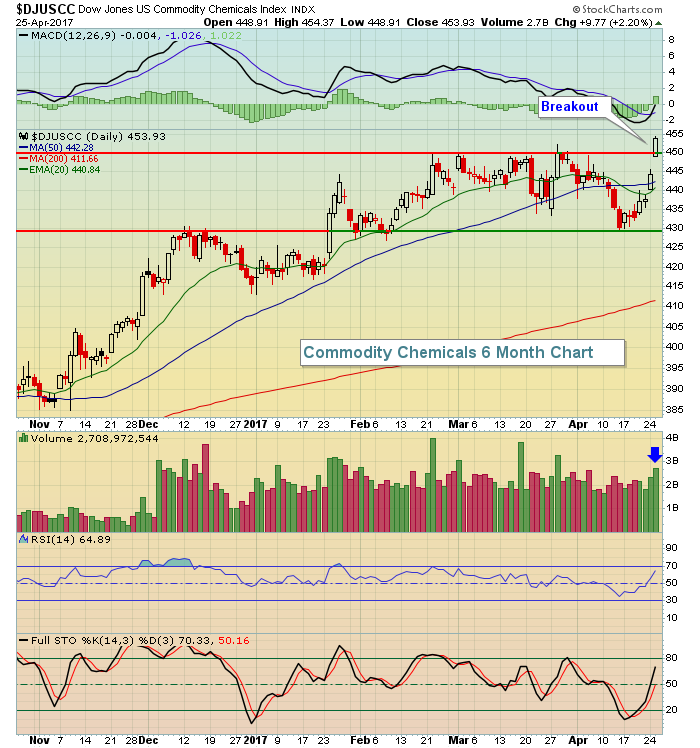
Commodity chemicals ($DJUSCC) surged on Tuesday and broke out of its sideways consolidation - a very bullish breakout indeed that was confirmed with heavier than normal volume (blue arrow below):
 I would expect more short-term strength here as technical buyers emerge. A pullback to the 450 level, however, would be a solid signal to look for stocks in this space for possible entry.
Historical Tendencies
May is just a few trading days away so here is the annualized return for this calendar month on each of the following indices:
S&P 500 (since 1950): +2.67%
NASDAQ (since 1971): +10.64%
Russell 2000 (since 1987): +15.39%
From the numbers above, it's fairly obvious that money does tend to rotate more toward smaller and more aggressive stocks.
Key Earnings Reports
(actual vs. estimate):
ANTM: 4.68 vs 3.85
BA: 2.01 vs 1.91
GD: 2.48 vs 2.32
HSY: 1.31 vs 1.26
NOC: 3.63 vs 2.90
NSC: 1.48 vs 1.35
PEP: .94 vs .91
PG: .96 vs .94
STT: 1.21 vs 1.10
TMO: 2.08 vs 2.02
UTX: 1.48 vs 1.39
WM: .66 vs .66
(reports after close, estimate provided):
AMGN: 3.00
FISV: 1.18
LVS: .60
PYPL: .33
SU: .21
Key Economic Reports
None
Happy trading!
Tom


