Market Recap for Wednesday, May 3, 2017
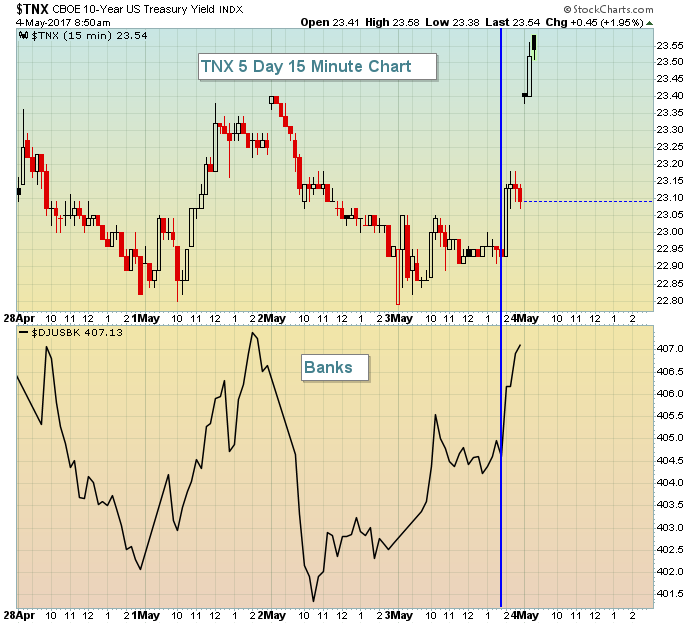
Financials (XLF, +0.80%) were easily the best performing sector on Wednesday as banks ($DJUSBK) led the rebound in interest-sensitive stocks. After gapping lower yesterday, the 10 year treasury yield ($TNX) climbed throughout the session and finished back above the 2.30% level. This came on the heels of the FOMC's latest announcement where Fed Chair Janet Yellen suggested the slowdown in GDP was "transitory" and traders immediately placed bets on another rate hike in June.
At 2pm yesterday, the time of the FOMC announcement, the TNX spiked higher and banks followed suit:
 Given the surge in the TNX this morning, I'd expect to see financials again lead the market on an absolute and relative basis.
Pre-Market Action
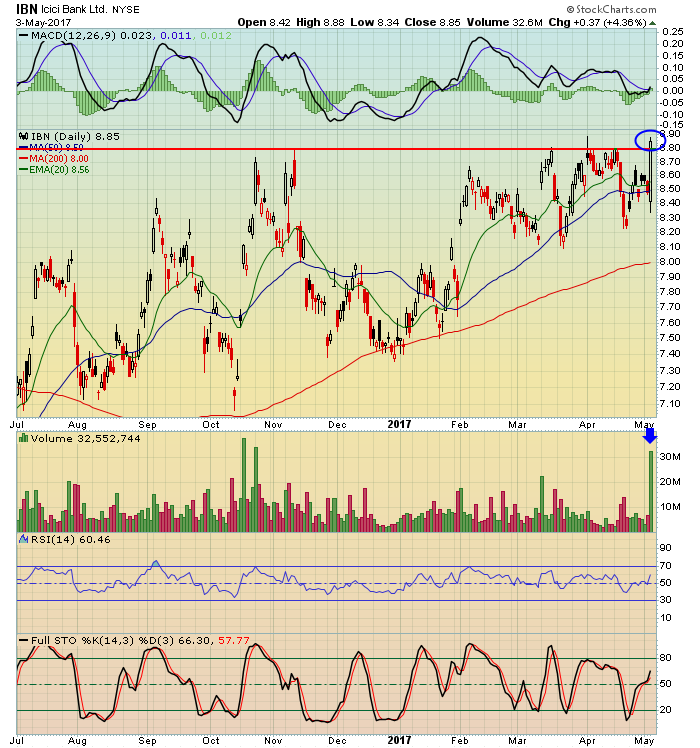
The 10 year treasury yield is surging this morning to 2.36%, its highest level in almost a month. The selling of treasuries is resulting in a resurgence in financial stocks, especially banks. Ibici Bank (IBN) was able to break out on the FOMC announcement Wednesday. Here's the chart:
 Banks should do well again today as Dow futures are up 40 points with 30 minutes left to the opening bell.
Current Outlook
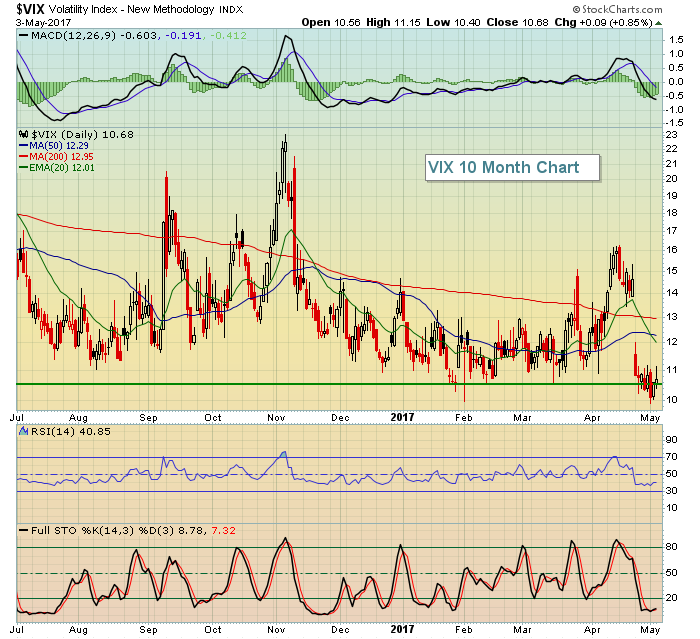
The Volatility Index ($VIX) remains at low levels and that tells us that traders fear little at the moment. In this environment, the market typically handles bad news in stride while climbing on good news. The last two bear markets began with VIX readings at or above 17. Currently, the VIX resides at 10.68 and that's very bullish to me. Check out the chart:
 We saw the VIX fall to the 10-11 area quickly back in late January and early February - just prior to a big advance in the S&P 500 - but it's been there now for the past several trading sessions. I'm looking for additional strength in the S&P 500 during May, breaking through and closing above 2400 for the first time in history.
Sector/Industry Watch
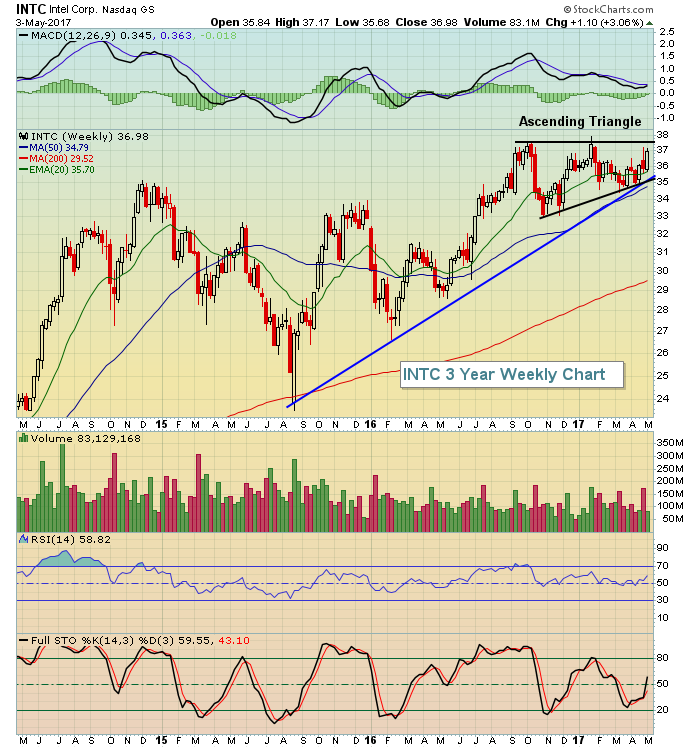
The Dow Jones U.S. Semiconductors Index ($DJUSSC) has not moved much over the past 5-6 weeks as it consolidates following a negative divergence emerging on its weekly chart earlier in 2017. Despite this, Intel Corp (INTC) is setting up in a very bullish ascending triangle pattern that I expect will resolve itself in a high volume breakout. Here's the current look:
 A confirmed volume breakout would suggest a measurement on INTC to 42.00.
Historical Tendencies
The Russell 2000 has been the best performing index during May historically. However, there's a period during May from the 13th through the 24th. Here's the annualized performance of the Russell 2000 during May:
May 1st through 12th: +18.73%
May 13th through 24th: -16.37%
May 25th through 31st: +76.78%
Key Earnings Reports
(actual vs. estimate):
ABEV: .05 vs .05
CNQ: .17 vs .13
D: .97 vs .93
ITUB: .29 vs .28
OXY: .15 vs .14
PPL: .62 vs .62
REGN: 2.16 vs 2.50
STO: .35 vs .22
ZTS: .53 vs .48
(reports after close, estimate provided):
ATVI: .16
CBS: .95
MNST: .32
Key Economic Reports
Initial jobless claims released at 8:30am EST: 238,000 (actual) vs. 246,000 (estimate)
Q1 productivity released at 8:30am EST: -0.6% (actual) vs. +0.0% (estimate)
March factory orders to be released at 10:00am EST: +0.4% (estimate)
Happy trading!
Tom


