Market Recap for Monday, May 22, 2017
Utilities (XLU, +0.86%), technology (XLK, +0.80%) and industrials (XLI, +0.77%) were the sector leaders on Monday, aiding our major indices as they mostly have erased the big losses from last Wednesday. The XLI has been a leader of late and is threatening an absolute price breakout and its highest relative close (vs. the S&P 500) since December. Here's the visual:
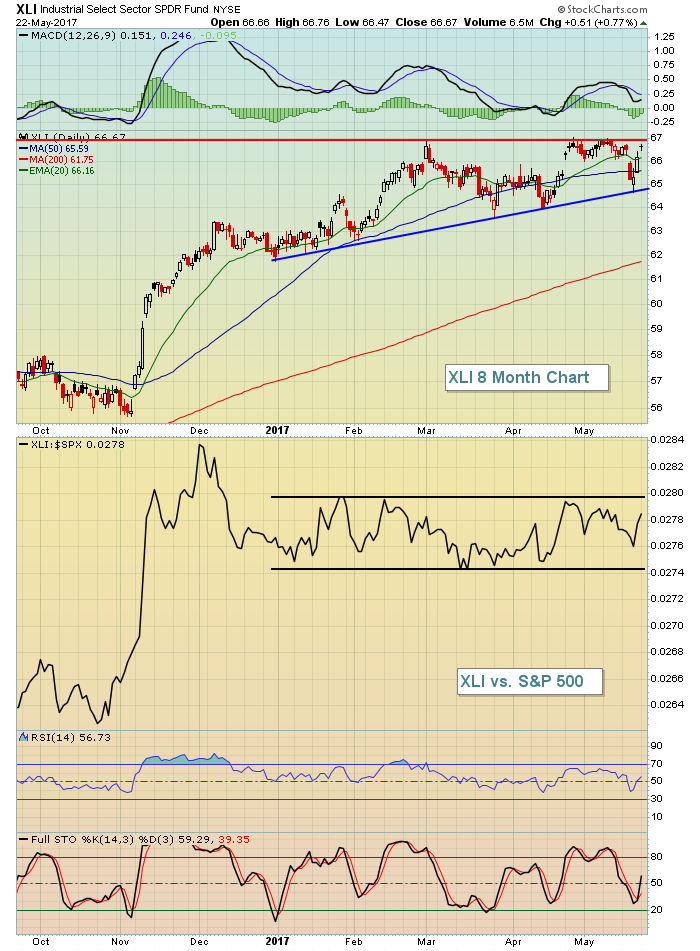 Rising trendline support is now near 65 with a breakout looming at 67 so the XLI is narrowing its trading range. This ascending triangle is a very bullish pattern that I expect to ultimately lead to a breakout above 67 with a measurement to approximately 71.
Utilities finally made a significant breakout, clearing overhead price resistance just above the 52 level. Over the past two months, there have probably been a dozen attempts to close above the March 27th open of 52.10 without any success.....until yesterday. While I'm not expecting relative leadership from utilities in the near-term, the absolute price breakout should be respected:
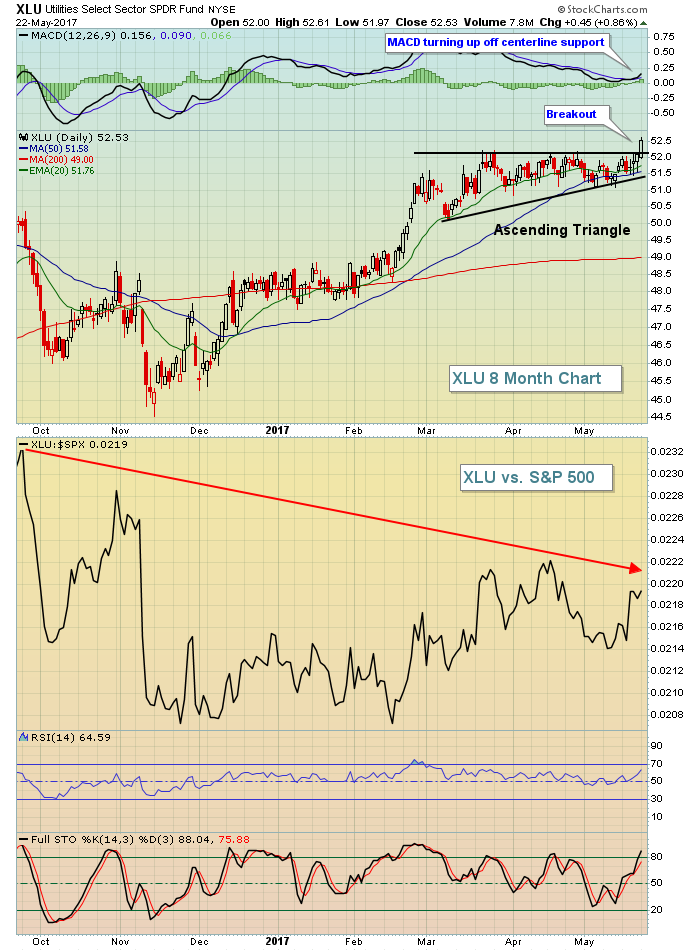 Relative weakness remains overall for utilities despite their Monday breakout.
Pre-Market Action
I will be interested to see the new home sales report, which will be released in approximately one hour, at 10:00am EST. Home construction ($DJUSHB) made a breakout on Monday, closing at its highest level since the first half of 2007. A solid new home sales report this morning could really send this group soaring.
Global indices were mixed with Asian markets mostly lower overnight while Europe is bouncing. In particular, the German DAX ($DAX) bounced off rising 20 day EMA with a very solid daily MACD in play - a bullish technical development. That bounce also occurred after backtesting its breakout to all-time highs above 12500.
Dow Jones futures are higher by 50 points with 30 minutes left to the opening bell.
Current Outlook
The small cap Russell 2000 ($RUT) is the only major index to fail thus far in its attempt to climb back above its open from last Wednesday. While intermediate-term price support on the RUT was never tested near 1345, short-term price support at 1380 was lost and the RUT's next major test will be clearing that level on a closing basis. Here's the current technical outlook on the RUT:
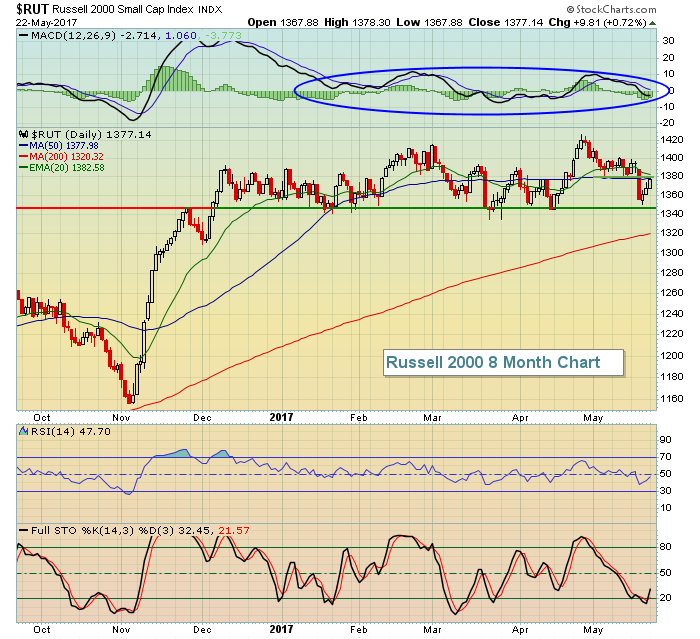 The Russell 2000's relative strength has been weak, but there have been no significant price breakdowns. Therefore, relative strength could resume at any time. The sideways action in 2017 is clearly reflected in a MACD that has barely strayed from its centerline (blue circle above). The rectangular consolidation is bullish following an uptrend so the most likely technical resolution here is a close above 1420, signaling the next significant move higher.
Sector/Industry Watch
The Dow Jones U.S. Industrial Suppliers Index ($DJUSDS) surged 1.73% on Monday, extending its three day rally off key price support. If our major indices are going to turn higher, they'll need various industry groups to bounce off support levels and begin trending higher and, thus far, that's exactly what the DJUSDS is doing. Take a look:
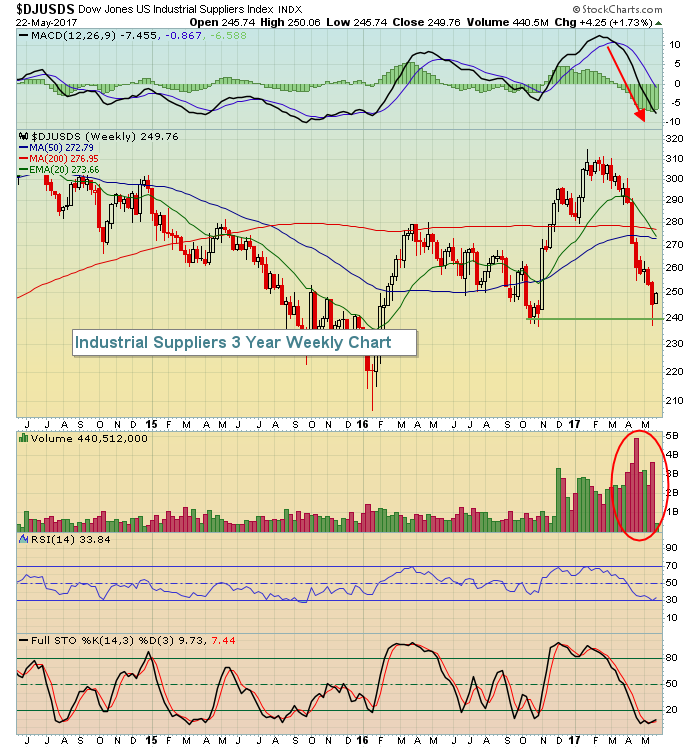 Let me emphasize this is nothing more than a dead cat bounce for now. But the point is that the bounce has occurred off key price support established in October 2016. The weekly MACD is very bearish and volume trends are ugly as well. The rapidly declining 20 week EMA will serve up the most significant resistance in the weeks ahead.
Historical Tendencies
Since 1950, the S&P 500 has risen 34 times during the month of June.....and declined 33 times. The only calendar month to have declined more times than it's advanced over this time frame is September.
Key Earnings Reports
(actual vs. estimate):
TOL: .73 vs .62
Key Economic Reports
May PMI composite to be released at 9:45am EST: 53.2 (estimate)
April new home sales to be released at 10:00am EST: 602,000 (estimate)
Happy trading!
Tom


