Market Recap for Thursday, May 25, 2017
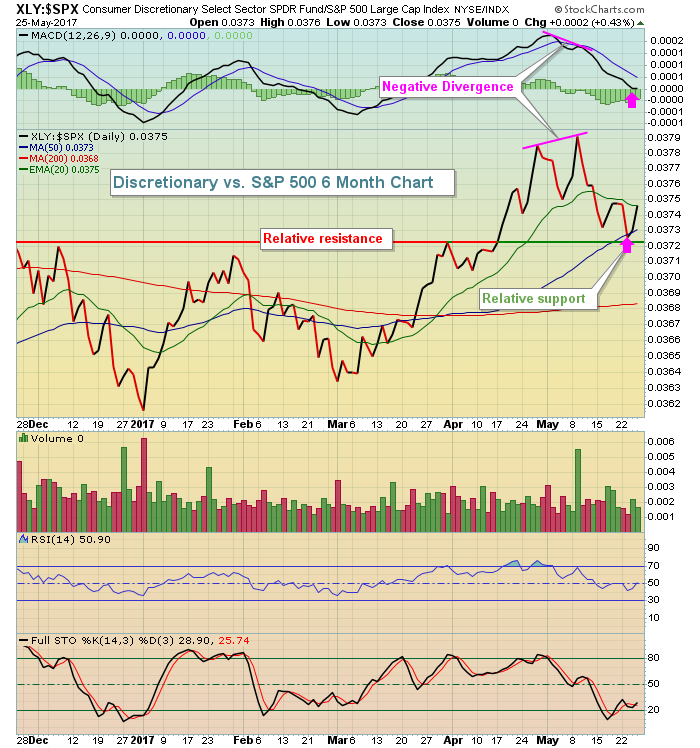
Retailers led another U.S. market rally on Thursday and helped provide leadership for the consumer discretionary sector (XLY, +0.88%), which outperformed the benchmark S&P 500 for one of the few times over the past 2-3 weeks. There had been previous slowing momentum in place on the XLY:$SPX ratio and it was literally resolved earlier this week, just before relative strength resumed today. Take a look at this relative chart:
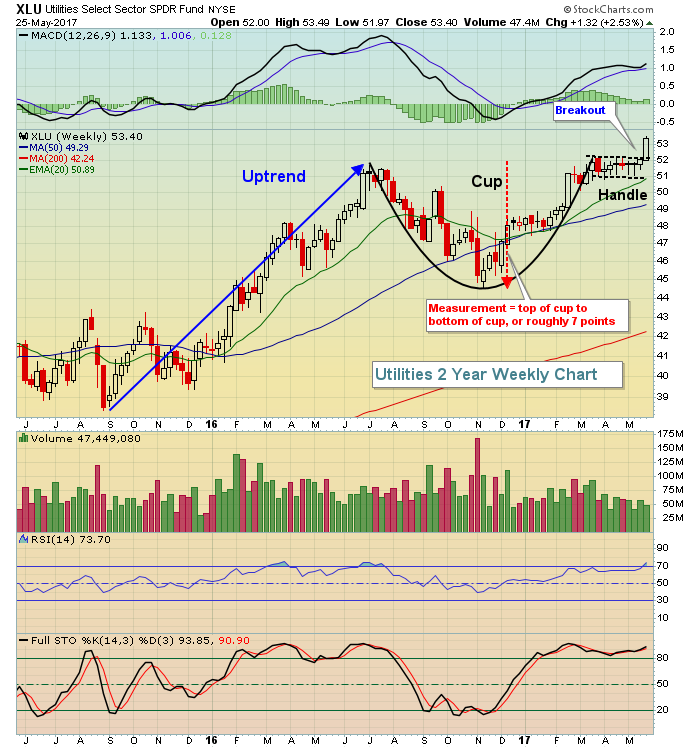
 Utilities (XLU, +.81%) also performed very well on Thursday, as it continues trending higher after its recent breakout above cup resistance near 52. The measurement of this pattern is to the 59-60 area in time. While I don't expect utilities to continue to lead a bull market, it very well could lead this summer as the S&P 500 remains vulnerable to extended selling due to a nasty negative divergence on its weekly chart as reflected below in the Current Outlook section. In the meantime, check out this bullish pattern on the XLU and its potential measurement over the next several weeks/months:
 The measurement of 7 points is added to the breakout level of 52 to come up with a potential measurement to 59. If the negative divergence on the S&P 500 kicks in this summer and we see overall market weakness, it could be due to a temporary decline in U.S. treasury yields - a potential catalyst for utilities. Or perhaps the S&P 500's bull market run continues despite the negative divergence and utilities simply follow the rest of the market higher.
Pre-Market Action
April durable goods fell 0.7%, but came in slightly better than the -1.0% drop that was widely expected. The second estimate of Q1 GDP, however, bested expectations (+1.2% vs +0.8%).
A weak dollar continues to lift gold, which is up another 10 bucks this morning. Crude oil ($WTIC) is down just slightly this morning, but is back beneath $49 per barrel. That's put pressure on energy of late.
Dow Jones futures are down 18 points 30 minutes before the opening bell.
Current Outlook
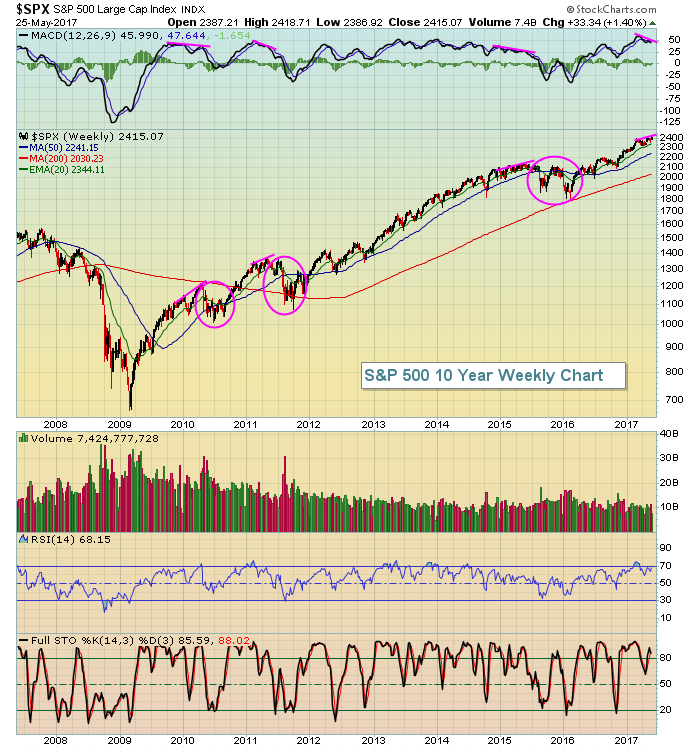
Perhaps the biggest issue the S&P 500 faces over the next few months is the negative divergence on its weekly chart. These divergences do not provide guarantees of weakness, but they do alert us to a higher level of risk. Rotation will most likely be key throughout the summer so trading in industry groups that have previously been strong, but are currently consolidating, will likely produce the best reward to risk trading candidates. Here's that negative divergence:
 The pink lines above show previous negative divergences and subsequent weakness (pink circles). Note that this weakness typically occurred, or at least started, during the summer months. If you look during 2013 and 2014, however, you'll note that there were negative divergences that were not followed by significant weakness. Again, negative divergences do not provide guarantees, but months later don't be shocked if the S&P 500 has corrected 8-10%.
Sector/Industry Watch
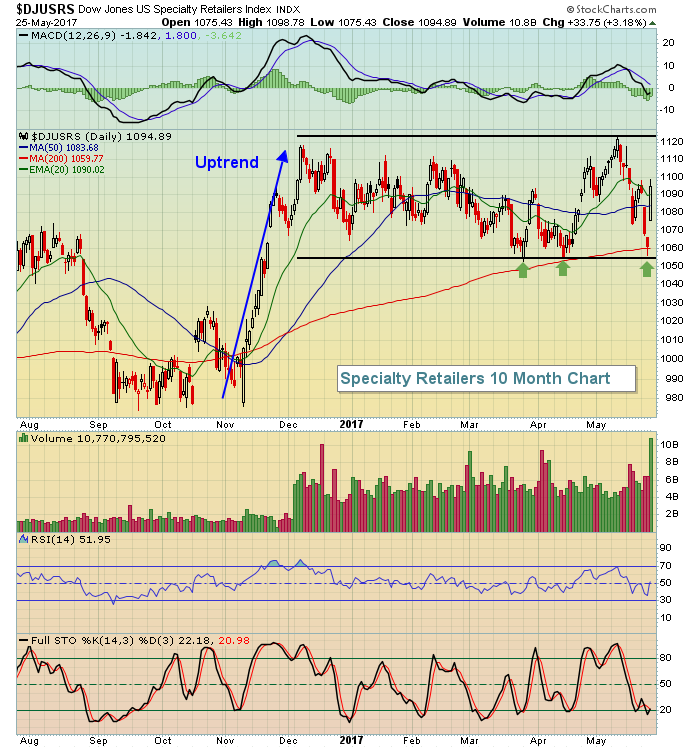
Specialty retailers ($DJUSRS) surged more than 3% on Thursday, helping to lead discretionary stocks. But this is a group that has been broken technically and the bounce occurred off major price support as shown:
 This represents a triple bottom now so clearly we have very strong and significant price support at the 1055 level. Keep in mind that yesterday's advance also occurred with very heavy volume and we're in a bullish sideways consolidation period after a prior uptrend. I expect this group to breakout before it breaks down.
Historical Tendencies
Fridays (+17.74%) have been the second best calendar day of the week to trade the S&P 500 (since 1950), trailing only Wednesdays (+19.64%) in terms of annualized performance. Mondays (-16.06%) have easily been the worst calendar day of the week for the bulls.
Key Earnings Reports
None
Key Economic Reports
April durable goods released at 8:30am EST: -0.7% (actual) vs. -1.0% (estimate)
April durable goods ex-transports released at 8:30am EST: -0.4% (actual) vs. +0.4% (estimate)
Q1 GDP (2nd Estimate) released at 8:30am EST: +1.2% (actual) vs. +0.8% (estimate)
May consumer sentiment to be released at 10:00am EST: 97.6 (estimate)
Happy trading!
Tom


