Market Recap for Wednesday, June 21, 2017
Biotechs ($DJUSBT) are the "semiconductors of healthcare". When they move, they move! Healthcare (XLV, +1.27%) was easily the best performing sector on Wednesday as the DJUSBT soared 3.43%. Unless we see a major reversal between today and tomorrow, we'll have a very significant breakout on the weekly chart. Here's the visual:
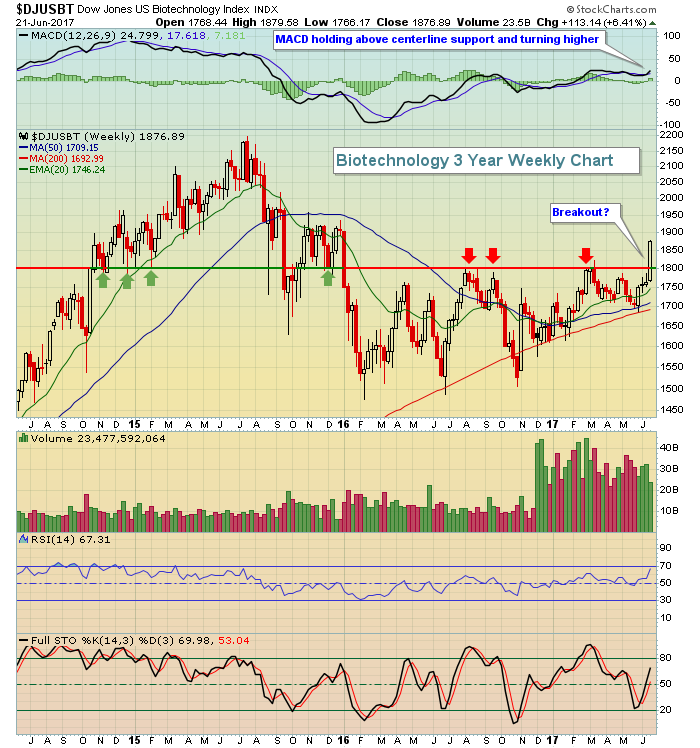 This is a repeat of a chart that I highlighted on Wednesday, but it's worth showing again. Because it's a weekly chart, this week's candle doesn't complete until Friday's close. There's still a chance we could close beneath 1800, which would be a very bearish development. But barring that reversal, the DJUSBT has finally forged through resistance at that level and this is a group that tends to move extremely fast - similar to the semiconductors ($DJUSSC) in technology. Here's a look back at the DJUSBT a few years ago to show how quickly bullishness can accelerate within this space:
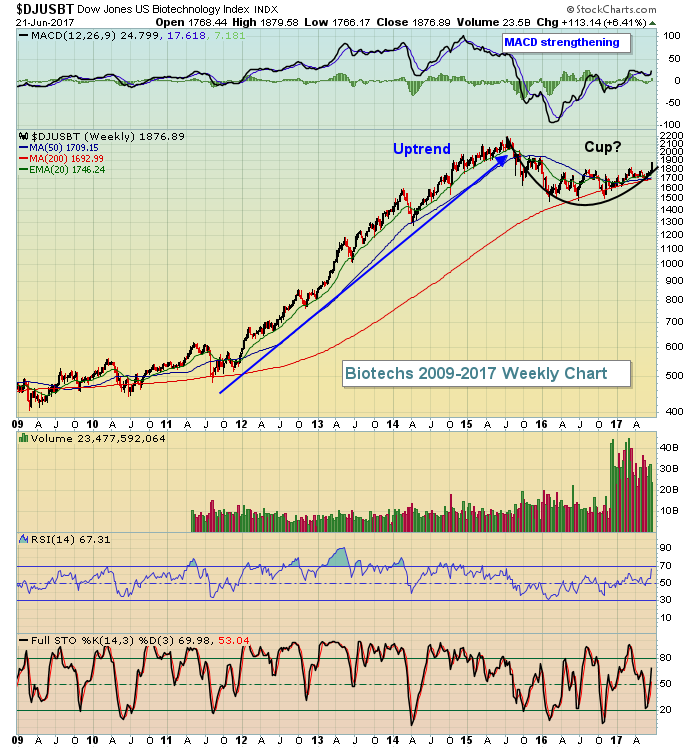 The 2011-2015 period was nearly parabolic for biotechs. With few pullbacks along the way, biotechs quadrupled in just four years. Currently, a cup appears to be forming. The cup with handle is a continuation pattern that follows a prior trend and eventually breaks out in the direction of that prior trend. So clearing the 1800 resistance seems like it will lead to much more strength in coming months - to potentially print the right side of the cup near 2200. As I mentioned in yesterday's blog article, biotechs love the month of July, their best month of the calendar year as they've averaged gaining 4.3% each July over the past 20 years. They've risen 9 of the last 10 years in July with an average return of 7.2%. Strength from here would simply follow historical norms and technical conditions would seem to indicate the July strength is starting a little early.
The SCTR score for the XLV is now 94.6, clearly the best among sectors. At the other end of the spectrum is energy (XLE, -1.61%), which has a SCTR score of 5.4. Tumbling crude oil prices ($WTIC, -2.25%) are the big drag on the sector and their current key price support level is being tested. The WTIC is featured below in the Sector/Industry Watch section.
Pre-Market Action
Crude oil is bouncing fractionally this morning after its recent trouncing. That should help to provide the energy sector some relief - at least in early trading.
Oracle Corp (ORCL) delivered an excellent quarterly earnings report after the bell on Wednesday and that should lift both software ($DJUSSW) and technology (XLK) stocks at the opening bell.
Overnight, we've seen mostly minor losses around the globe. That caution is spilling over to the U.S., where prices are set to open flat to slightly lower. Currently, Dow Jones futures are down 13 points with just 30 minutes left to the opening bell.
Current Outlook
When I look at the U.S. stock market, I typically start with the benchmark S&P 500, reviewing short-term intraday charts (anywhere from 5-30 days), intermediate-term daily charts (from six months to a year) and longer-term weekly charts (from 5-10 years). There is slowing momentum (negative divergences) on both the long-term and intermediate-term picture and that likely means a sideways, consolidating market this summer. In the very near-term, the S&P 500 is trying to hold onto gap support established earlier this week and as reflected below:
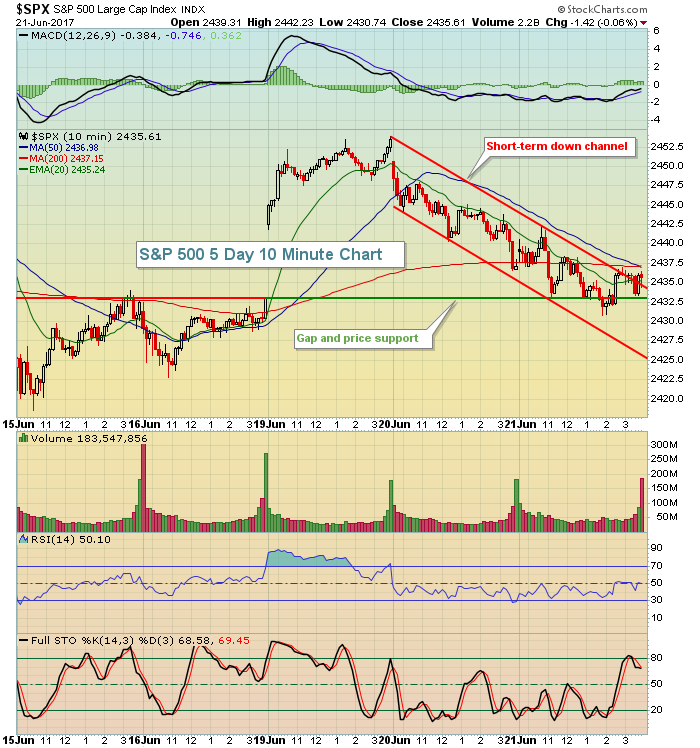 Near 2pm on Wednesday, the S&P 500 threatened to break down beneath gap and price support, but quickly recovered. By day's end, the S&P 500 appeared to break out above its upper down channel resistance line. Was it a head fake? We'll find out at today's open, but U.S. markets are fairly flat so we might have to see the direction once the opening bell rings. Just keep in mind that both the intermediate-term and longer-term charts are suspicious at best, so failure to hold support on the very near-term chart could lead to accelerated selling in our major indices.
Sector/Industry Watch
Crude oil ($WTIC) has been under selling pressure for months and doesn't seem to be letting up. It's hard to say if black gold is dropping because of anticipated slowing demand, oversupply or both. The point is that it continues to fall. There are two key levels to watch:
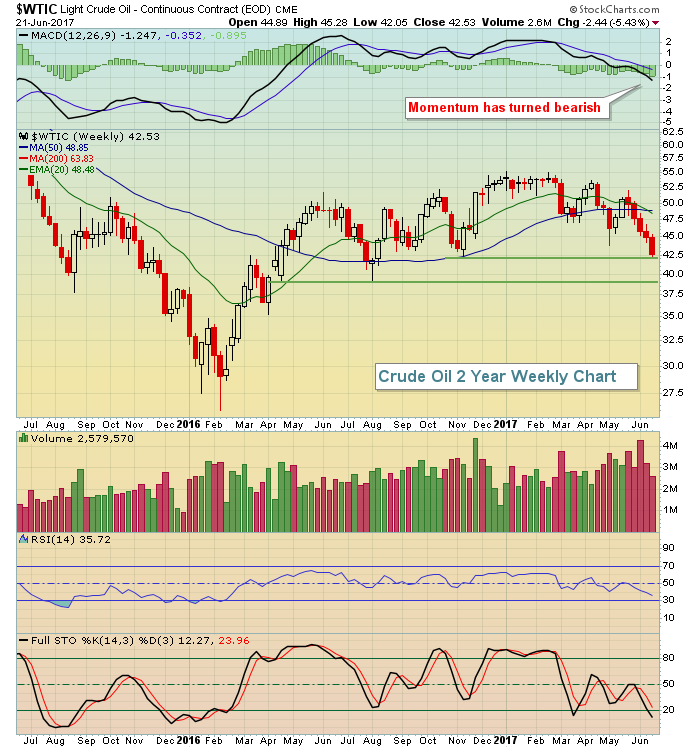 Yesterday, crude oil hit price support close to $42 per barrel and bounced. We should see a bounce from this level, but not much has helped recently. If $42 support fails to hold, it'll likely be another quick drop to $39 per barrel where a bigger support level resides.
Historical Tendencies
We are in the midst of a bearish period for Russell 2000 (small caps) stocks. From June 18th through June 25th, the Russell 2000 has produced annualized returns of -45.84% since 1987.
Key Earnings Reports
(actual vs. estimate):
ACN: 1.52 vs 1.50
CCL: .47 (estimate)
(reports after close, estimate provided):
BBBY: .66
Key Economic Reports
Initial jobless claims released at 8:30am EST: 241,000 (actual) vs. 240,000 (estimate)
April FHFA house price index to be released at 9:00am EST: +0.5% (estimate)
May leading indicators to be released at 10:00am EST: +0.3% (estimate)
Happy trading!
Tom


