Market Recap for Tuesday, June 6, 2017
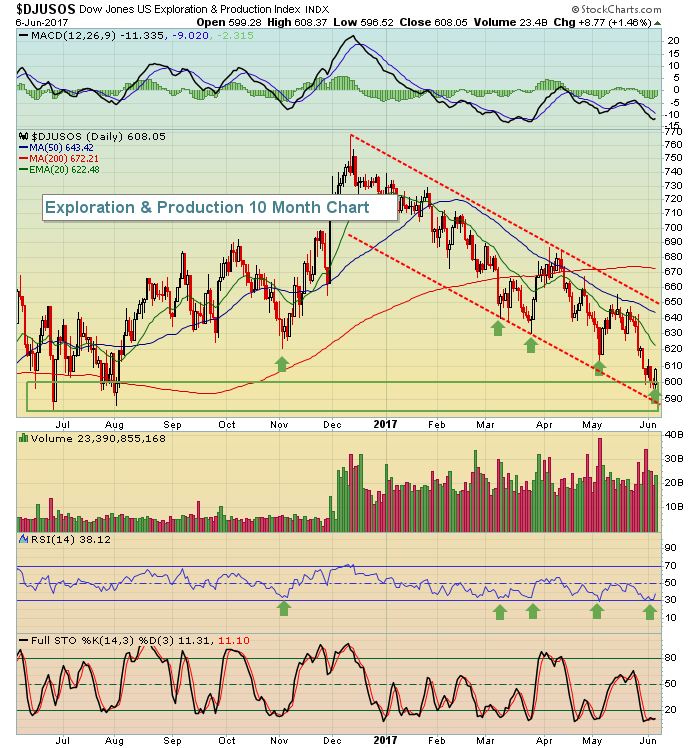
Energy (XLE, +1.18) was easily the best performing sector on Tuesday as materials (XLB, +0.06%) was the only other sector to finish in positive territory - barely. Over the last five trading days, the XLE has printed a hollow candle (closing price finishes above opening price) four times. That has not happened since November and it did trigger a significant uptrend for the next 6-7 weeks. We'll see if we get a repeat. Energy got a lift from coal ($DJUSCL) and oil exploration and production stocks ($DJUSOS) as these two industry groups rose 2.12% and 1.46%, respectively. Both were very oversold and needed a bounce, but the DJUSOS, in particular, bounced off a key price support zone on its one year chart as you can see below:
 The current down channel is highlighted with the downsloping red dotted lines. Clearly, the DJUSOS is bouncing off a recent test of that lower downtrend line. Also note the green arrows where you can see that the DJUSOS makes, for the most part, small bounces each time the daily RSI hits or approaches 30. It just turned up off of 30 again so an upcoming test of 20 day EMA resistance is likely - that's at 622 and falling.
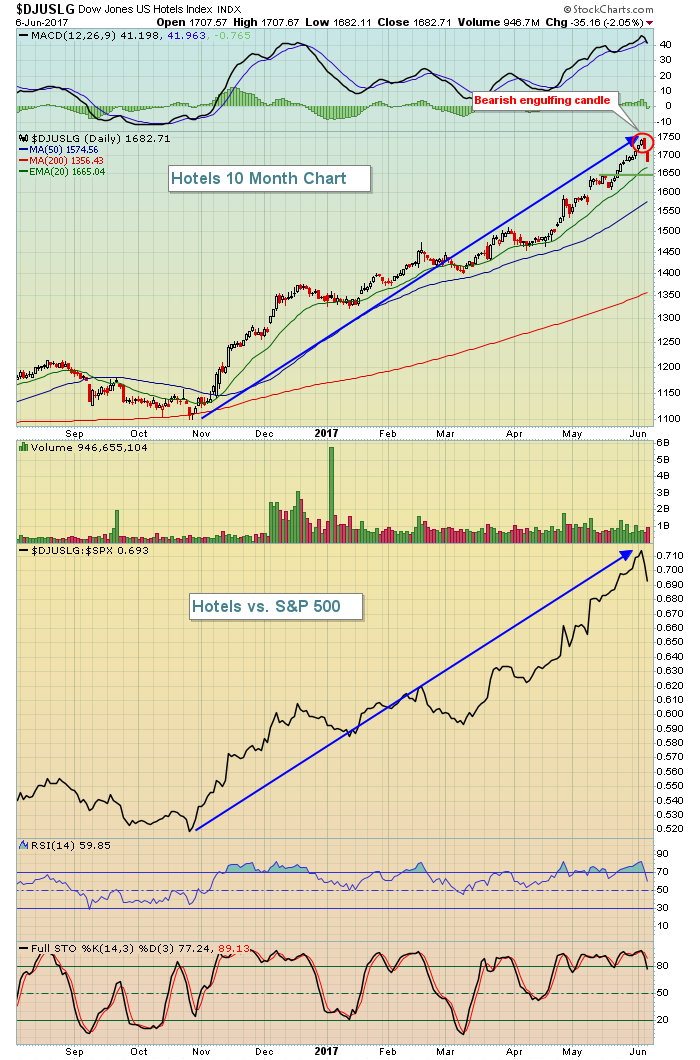
Consumer discretionary (XLY, -0.86%) and industrials (XLI, -0.68%) were the primary laggards on Tuesday, pulling the major indices lower. 21 of 23 industry groups among discretionary stocks finished the day lower, including several of the retail groups that continue to perform dismally. Hotels ($DJUSLG) were the worst performers though and their chart is shown below in the Sector/Industry Watch section.
Pre-Market Action
Dow Jones futures are up 1 point with 30 minutes left before the opening bell. The 10 year treasury yield ($TNX) is flat near 2.15%, gold is down a few bucks and has fallen close to 1% this morning on OPEC tensions. Global markets are mixed, although China's Shanghai Composite ($SSEC) did tack on more than 1% gains overnight.
Current Outlook
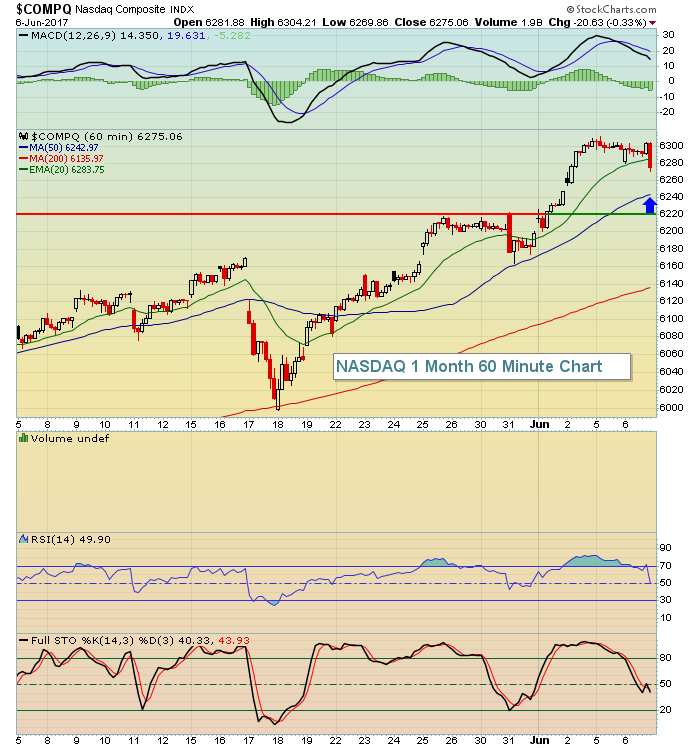
The NASDAQ has been the undisputed leader among the major U.S. indices. The finish on Tuesday in the final hour was very weak and could begin a more significant short-term decline to the 6220-6240 area, where I'd expect to see more buyers appear. Check out the 60 minute chart below:
 The NASDAQ was very overbought on its 60 minute chart at its latest price high so the current move lower is likely nothing more than simple profit taking. A move below 6220 could trigger more selling, however, so be watching for that.
Sector/Industry Watch
The Dow Jones U.S. Hotels Index ($DJUSLG) has been a great performing industry group within the consumer discretionary space, but profit taking has kicked in. While short-term selling is apparent and may continue near-term, I expect we'll see another surge from the group once the recently overbought conditions are fully relieved. Here's the chart:
 Hotels have been a great place to invest or trade since November and I suspect an upcoming 20 day EMA test and/or price support test near 1650 will provide another opportunity. During bull markets, a stock or index can remain overbought for lengthy periods and the DJUSLG chart highlights that perfectly. The RSI and stochastics have both been overbought (RSI 70+ and stochastic 90+ readings are what I consider to be overbought) for weeks at a time, but have done nothing to slow this industry group down. 1650-1665 is the range where I'd look for a reversing candle for another pop to the upside.
Historical Tendencies
The S&P 500 tends to struggle most in June during two distinct periods - June 7th through 9th and June 18th through 26th - which is typical of most calendar months. Here are the annualized returns during these two periods since 1950:
June 7th - 9th: -28.17%
June 18th - 26th: -26.97%
Considering that the S&P 500 has been flat (-0.02%) in June since 1950, it's deductive reasoning that the balance of June, outside the two bearish periods described above, is bullish.
Key Earnings Reports
None
Key Economic Reports
None
Happy trading!


