Market Recap for Thursday, July 27, 2017
The mostly unabated rise in technology shares off the early July low took a sudden turn lower on Thursday afternoon and the initial reactions to quarterly earnings reports from Amazon.com (AMZN) and Starbucks (SBUX) won't help this morning as they're down 2.72% and 6.25%, respectively, in pre-market action. The solid uptrend in the NASDAQ 100 ($NDX) actually broke a few days ago, but prices have continued pushing higher amid slowing price momentum. Check out this chart:
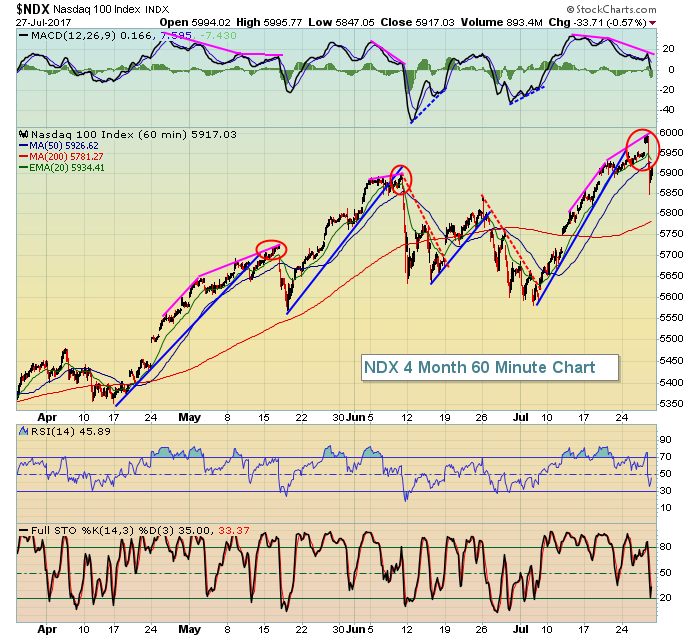 It's not unusual to see price action take a few days to even a week or two to reverse after a negative divergence emerges and an uptrend line breaks. Both those signs - negative divergences and trendline breaks - do put the market in jeopardy and increase short-term risks. Yesterday's action, while scary, was honestly to be expected and more short-term selling wouldn't be a surprise either. Notice on the above NDX chart that the negative divergence tends to print first, then we see a trendline break and typically one more price high......before the selling hits. It's not always a big selloff and the Current Outlook section below takes a look at the NDX on daily and weekly time frames.
Pre-Market Action
Crude oil ($WTIC) has risen above $49 per barrel as the XLE attempts to break above 67.00 price resistance. Gold ($GOLD) also continues to show strength and could remain an alternative to technology shares which could remain under pressure.
Futures here are quite weak, especially on the NASDAQ, where we could see a 0.50%-0.75% drop at the opening bell. Yesterday's intraday low on the NASDAQ of 6318 is important because we saw buyers step in at that level on very heavy volume. A move below that level would likely generate much more selling interest, so beware.
Current Outlook
Earlier I pointed out the risks on the NDX 60 minute chart as we've now broken an uptrend following a negative divergence. It's always difficult to determine how much selling we might see simply by looking at an hourly chart, so let's step back and take a "bigger picture" view of the NDX on its daily and weekly charts.
First, the daily chart....
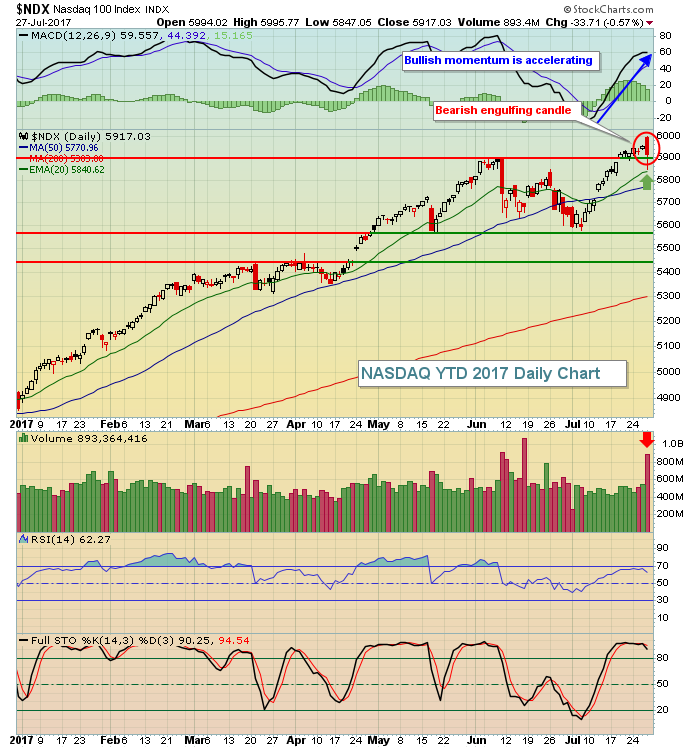 There is a reversing bearish engulfing candle that printed on Thursday and it was accompanied by very heavy volume. That's always a short-term bearish development. There were two positives that I saw though. First, we recovered by the close to hold onto initial price support near 5900 and gap support closer to 5880. Second, with a solid and accelerating MACD to the upside, the rising 20 day EMA provided excellent support as it typically does during uptrends. My conclusion after looking at the daily chart? We're in a trading range from the rising 20 day EMA (support), currently at 5840, to Thursday's open of 5994 (resistance).
But let's step out further to the longer-term weekly chart and see what that says.....
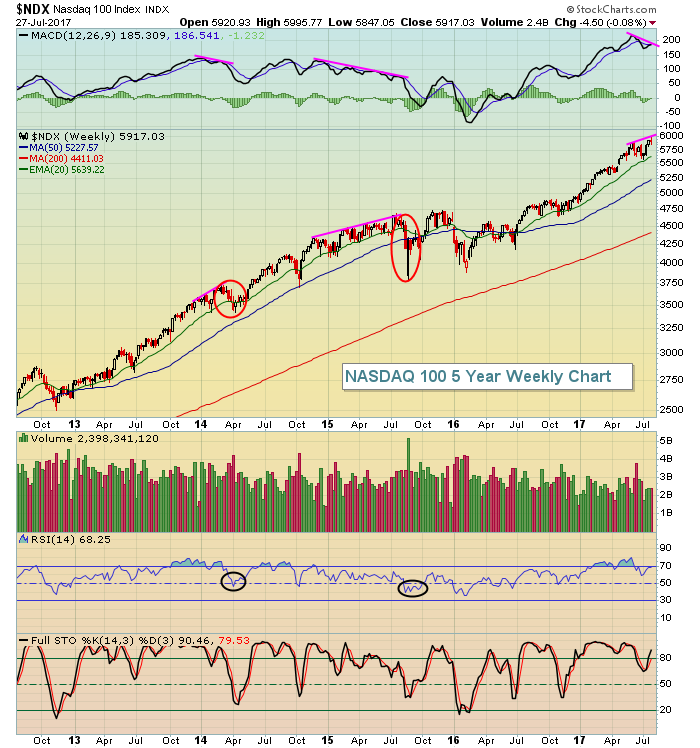 This is where the more significant technical issues and worries begin. It's never comforting to see a negative divergence emerge on a weekly chart. I wrote about the weekly negative divergence on the railroads more than two months ago and they continue to underperform the market. It can take several weeks to unwind these negative divergences and while they're unwinding, price action normally consolidates, but sometimes we see severe selling episodes. We're also in the midst of summer when the propensity for selling U.S. equities increases. Following weekly negative divergences in 2014 and 2015, we saw fairly heavy selling and weekly RSIs fell back in the 40-50 range both times. I look for 50 period SMA tests and/or weekly MACD centerline tests to unwind the momentum issues. Currently, the 50 week SMA on the NDX is at 5227 and rising rapidly. Testing that moving average over the next couple months would require some scary selling. But that does usually occur after parabolic rises like the one we've seen off the late June 2016 low.
I do not believe we are beginning a bear market, but I wouldn't be surprised if this turns out to be the start of a mild correction.
Sector/Industry Watch
Walt Disney (DIS) rose nearly 3% on Thursday to help lead the broadcasting and entertainment group higher. While much attention was paid to the NASDAQ as that index posted big losses, the Dow Jones quietly pushed higher to a fresh all-time high - due to components like DIS. The DJUSBC is on the verge of a signficant breakout:
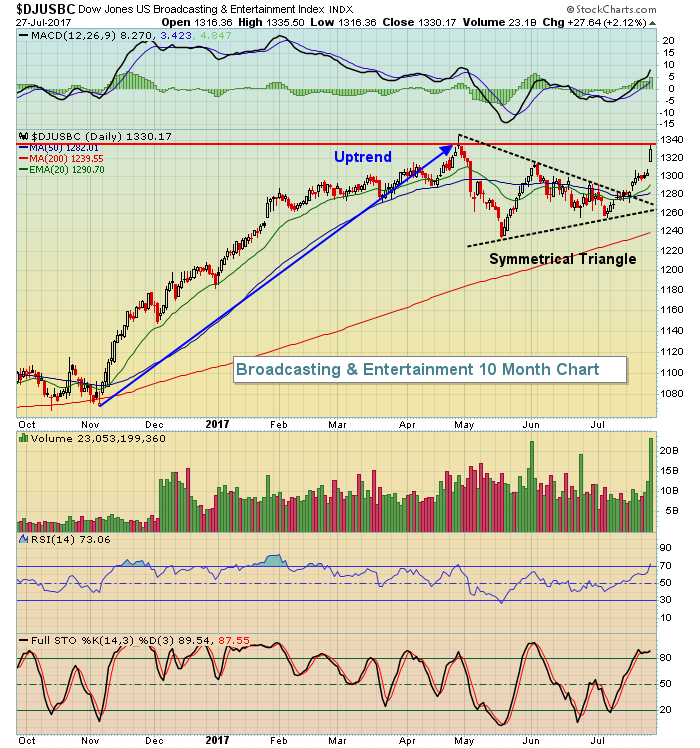 The DJUSBC broke out of a bullish symmetrical triangle (continuation pattern) earlier this month and yesterday's strong gains sent the index higher to challenge the late April high close. Note the increasing volume as accumulation appears to be taking place in anticipation of a breakout. A breakout would be quite bullish, while a pullback to test the rising 20 day EMA would represent a very solid reward to risk entry into this space.
Historical Tendencies
I've discussed on plenty of occasions how the stock market typically rallies at the end of calendar months and into the first week of the following calendar month. Well.....scratch that for the Russell 2000 as we end July and begin August. July 28th through 30th isn't usually bad, but from July 31st through August 6th, there are negative annualized returns for each day within this period since 1987 - with August 4th and 5th notably weak.
Key Earnings Reports
(actual vs. estimate):
AAL: 1.92 vs 1.87
ABBV: 1.42 vs 1.40
BCS: .12 vs .13
BHGE: (.11) vs .16
COL: 1.64 vs 1.58
CVX: .77 vs .89 (not sure if these numbers are comparable)
E: .27 vs .09
HCN: 1.06 vs 1.05
LYB: 2.82 vs 2.73
MRK: 1.01 vs .87
PEG: .62 vs .57
TRP: .56 vs .50
VTR: 1.06 vs 1.05
XOM: .78 vs .83
WY: .28 vs .27
Key Economic Reports
Q2 GDP released at 8:30am EST: +2.6% (actual) vs. +2.6% (estimate)
July consumer sentiment to be released at 10:00am EST: 93.1 (estimate)
Happy trading!
Tom


