Market Recap for Monday, July 24, 2017
It was another bifurcated session as the more aggressive NASDAQ and Russell 2000 led while the Dow Jones and S&P 500 took a breather. That's been the theme of late and as long as the more aggressive indices lead, it's a good sign for equities. Another good sign for equities is that Friday's close on the Volatility Index ($VIX) at 9.36 marked the second lowest reading on record, surpassed only by the December 23, 1993 close of 9.31. Extreme complacency suggests to me that the market is prepared to withstand bad news and does NOT represent the type of environment where major corrections or bear markets begin.
Financials (XLF, +0.44%) and technology (XLK, +0.24%) were the only sectors to end the session in positive territory. The former was led by banks ($DJUSBK), which bounced with a corresponding uptick in the 10 year treasury yield ($TNX). Here's a current look at the DJUSBK:
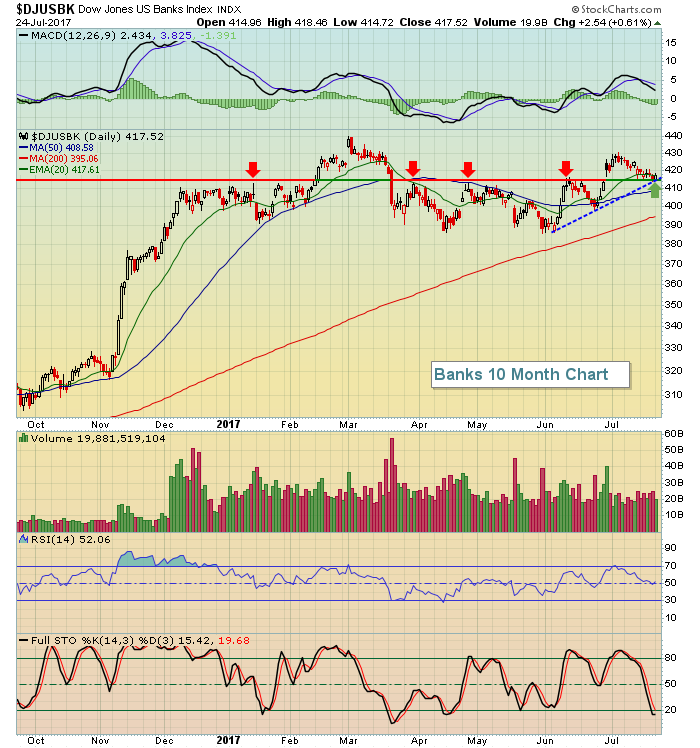 Short-term trendline support (blue dotted line) and price support (horizontal line) both should provide support to banks in the near-term and I believe we'll see the TNX begin to rise again into the Fed meeting, which starts today. That will help banks regain their momentum as well.
Technology has been helped recently by a very strong internet group, but the XLK may need to find other leadership after traders were disappointed with Alphabet's (GOOGL) quarterly results last night after the bell. GOOGL is down nearly 3% this morning in pre-market action.
Pre-Market Action
The FOMC meeting begins this morning so traders will certainly be keeping an eye on treasury prices and yields. Dow Jones futures are up 100 points on the strength of solid earnings and higher crude oil prices ($WTIC). The NASDAQ is lagging after a lackluster report from Alphabet (GOOGL).
Current Outlook
After a steady decline in the 10 year treasury yield ($TNX) during July, we're beginning to see the TNX rebound and that should help interest rate sensitive areas like banks ($DJUSBK) and life insurance companies ($DJUSIL), while dampening the short-term bullish hopes of utilities (XLU) and REITs ($DJR). Here's the short-term breakout of the recent downtrend in the TNX:
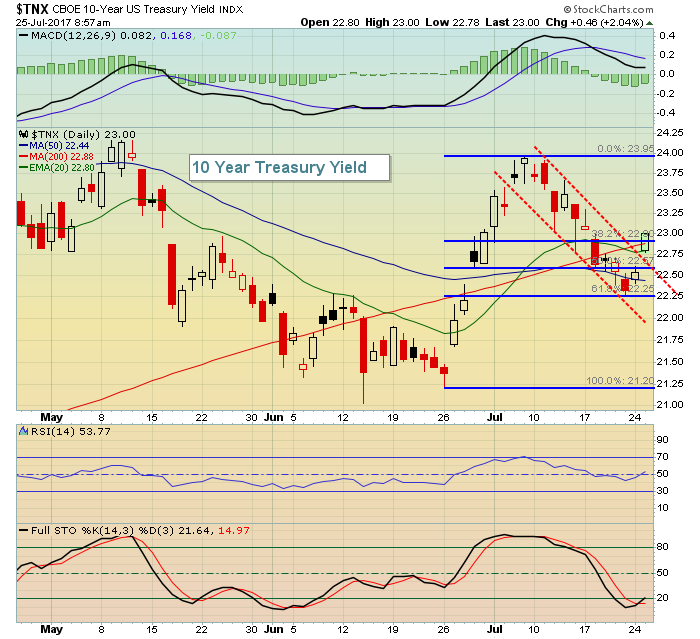 The recent pullback in the TNX was a perfect 61.8% Fibonacci retracement and now the down channel (red dotted lines) has been broken. That last candle represents the movement higher this morning in the TNX as the bond market opens before the stock market. I'm looking for an initial move back to 2.40% and that should provide tailwinds for the DJUSBK and DJUSIL, among other financial industry groups.
Sector/Industry Watch
On May 17th, I wrote briefly about railroads ($DJUSRR) in this very same section, saying that if railroads moved higher, it'd be a shocker to me. Well......they didn't move higher. In fact, since I wrote that article, the S&P 500 has risen 3% while railroads have fallen a little more than 2%. That's a five percentage point difference and the bleak technical outlook for railroads hasn't gotten any better. Here's the same weekly chart that I provided on May 17th - updated for action over the past couple months:
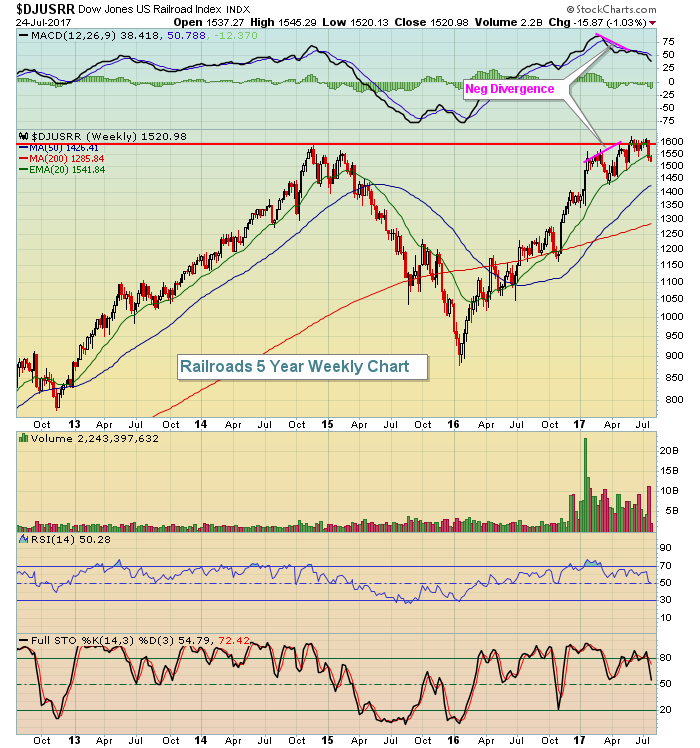 I do not like to trade in a sector that prints a long-term negative divergence on its weekly chart. Many times, it takes several weeks to unwind such slowing momentum so you can be stuck in a position, tying up cash that could otherwise be put to much better use in an area that has strong momentum.
From the above chart, the DJUSRR really struggled to break above 1600 price resistance and has now broken below its rising 20 week EMA with volume accelerating. This is a bearish development that I believe will likely lead to more selling ahead - or at least more consolidation. Let's allow the DJUSRR the necessary time to reset its weekly MACD at or close to centerline support and then reevaluate the group.
Historical Tendencies
Late July through early August is an anomaly on the NASDAQ in terms of performance. Typically we see strength at the end of calendar months into the first week of the following calendar month as market participants anticipate upcoming money flows, then actually experience it. The 26th through the 6th of all calendar months has produced annualized returns of +24.42% on the NASDAQ since 1971. But late July is different. July 27th through August 5th has actually produced annualized returns of -23.87% on the NASDAQ over nearly five decades. This does not guarantee us weakness, just that the NASDAQ does tend to struggle during this upcoming seasonal period. Perhaps it's a "buy on rumor, sell on news" type of deal relating to quarterly earnings?
Key Earnings Reports
(actual vs. estimate):
BIIB: 5.04 vs 4.36
CAT: 1.49 vs 1.26
DD: 1.38 vs 1.29
GM: 1.89 vs 1.72
KMB: 1.49 vs 1.50
LLY: 1.11 vs 1.04
MCD: 1.73 vs 1.62
MMM: 2.58 vs 2.59
UTX: 1.85 vs 1.77
(reports after close, estimate provided):
AMGN: 3.09
CB: 2.49
CNI: 1.00
EQR: .77
ESRX: 1.71
T: .74
TXN: .95
Key Economic Reports
FOMC meeting begins
May FHFA house price index to be released at 9:00am EST: +0.6% (estimate)
May Case Shiller home price index to be released at 9:00am EST: +0.3% (estimate)
July consumer confidence to be released at 10:00am EST: 117.0 (estimate)
Happy trading!
Tom


