Special Announcement
Greg Schnell and I will be co-hosting the latest StockCharts Outlook webinar tomorrow, July 8th at 11am EST. Please join us as we discuss what went right and wrong during the first half of 2017 and where we see the market heading in the second half. Have we topped? Are the bears ready to turn the tables on the bulls and drive prices lower? Greg and I will debate these questions and others and give you the areas we believe you should be focusing on as the heat of summer kicks in! First and foremost, this is a FREE webinar for StockCharts.com members. In order to attend, you must pre-register. CLICK HERE and then hit the green "Register Here" button to reserve your spot. Then simply grab your Saturday morning cup of coffee and join us! We hope to see you there!
Reminder
If you enjoy reading my blog each day (I sure hope so!), you can subscribe to my blog by scrolling to the bottom of any of my articles, typing in your email address and clicking the green "Notify Me!" button. Voila! From that point forward, my blog articles will be sent directly to your email at the moment they're published! And I think I speak for all of us blog authors here at StockCharts.com when I say that we really appreciate your support in the form of subscriptions. It's a free and overlooked feature here at StockCharts.com for the majority of blogs.
Market Recap for Thursday, July 6, 2017
Ok, let's get to the market. I'm not sugarcoating this. It was an ugly day yesterday. The Dow Jones lost 158 points and closed beneath its rising 20 day EMA for the second time in the past five sessions. And that's the best index right now. The NASDAQ closed below 6100 for the first time since May 19th, despite several attempts recently to do so. That will put pressure on the bulls for an answer to the increased selling pressure. The S&P 500 closed beneath its 50 day SMA for the first time since mid-May and it's resting now almost squarely on price support established from its latest breakout. Have a look:
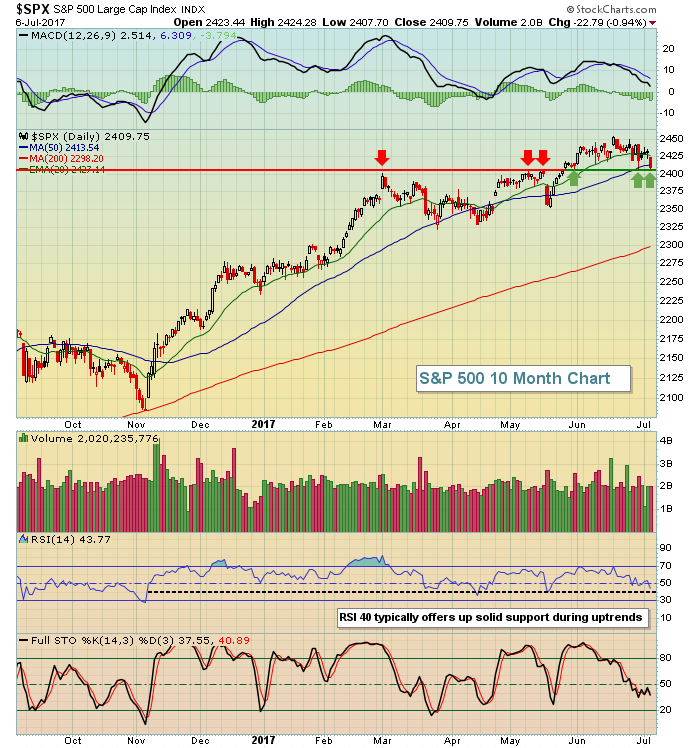 Isn't it strange how you want to enter long positions during a bull market, but you want to wait on that "pullback"? Then the market pulls back and you think the selling has just begun and you don't want to enter too early so you wait. Everyone goes through this mental game. If I try to look at the S&P 500 objectively, I do see a couple issues with jumping in right now. We are at a much better entry now than we were just 2-3 weeks ago. The S&P 500 has lost close to 2% and we're no longer overbought. But check out the Current Outlook section below and you'll see the reasons why it might be better to wait this thing out.
All nine sectors fell on Thursday so there was no safe haven. Healthcare (XLV, -1.29%) took the biggest hit, but that was the best performing sector in Q2 and was poised for some profit taking. The selling took the XLV down to test its rising 20 day EMA and this sector is the one sector I'd be okay entering at current prices. Here's the chart showing the profit taking to test its key short-term moving average:
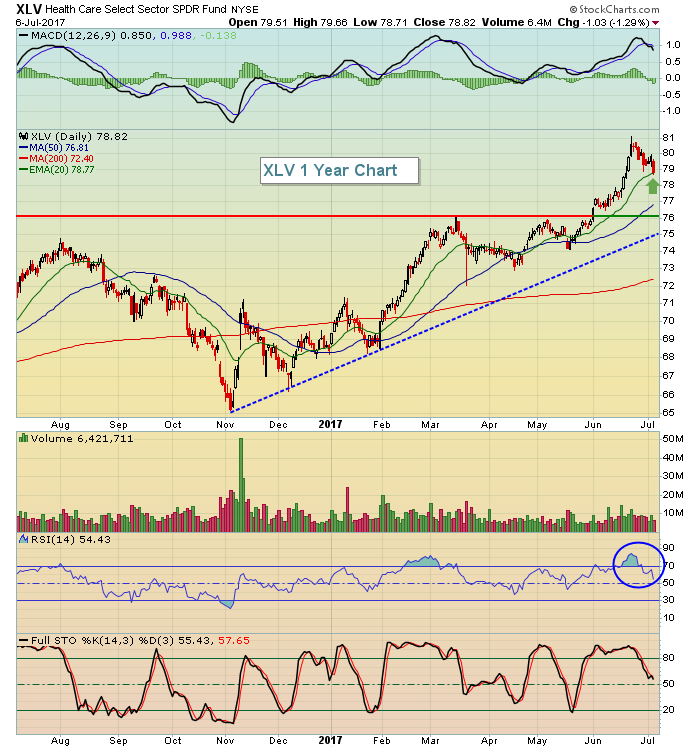 The XLV enjoyed a near parabolic move higher in June so a little selling to consolidate and base is a good thing technically. The key areas of support are the rising 20 day EMA (currently 78.77 - green arrow) and then price support closer to 76.00. The rising trendline intersects close to 75 and would represent a reasonable closing stop level for those wanting to trade this ETF. After a brief consolidation period, I'd look for the XLV to rebound to challenge recent highs....and ultimately break out.
Pre-Market Action
Crude oil ($WTIC) is down another 2% this morning while gold ($GOLD) has moved fractionally higher. Global markets are mixed while U.S. futures have turned decidedly positive after June nonfarm payrolls were released and came in higher than expected.
Dow Jones futures are higher by 40 points with roughly 30 minutes left to the opening bell.
Current Outlook
Here's the problem with buying the S&P 500 on this bout of selling. First, history tells us that the worst period of the year for equity prices is from the July 17th close to the September 26th close. That's based on research since 1950. Our benchmark index typically declines during these 10 weeks and we're likely to see another decline based on the weekly negative divergence that's currently printing.....and that's the second issue with buying right now. Check out this sign of slowing upside price momentum on the longer-term chart:
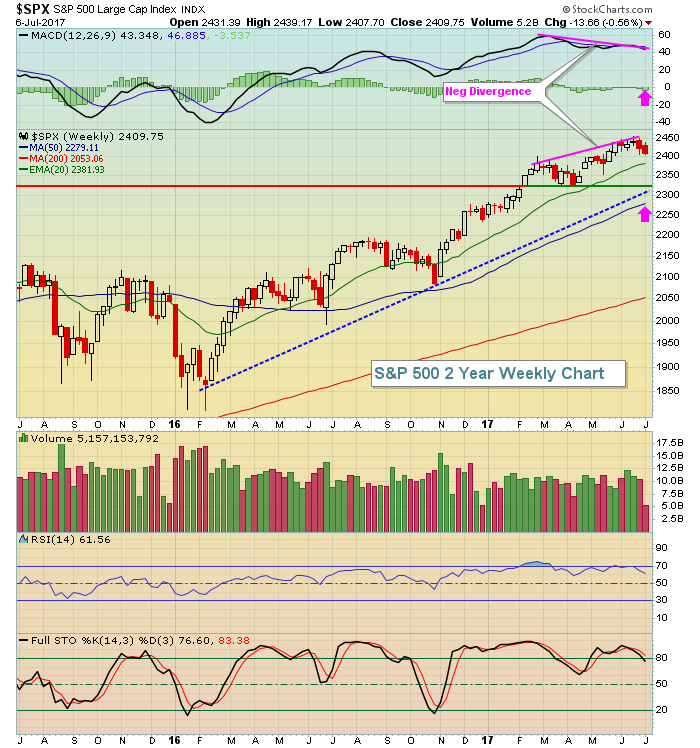 Don't be shocked to see 50 week SMA and MACD centerline tests (pink arrows) to reset the MACD. That would require weeks of consolidation, which fits into the seasonal pattern of the S&P 500. The lows back in April near 2320 would seem like a natural target, especially given the fact that the rising 50 week SMA is currently at 2279 and will continue to rise throughout the summer. Note that the trendline also would connect just above 2300.
Sector/Industry Watch
The Dow Jones U.S. Telecommunications Equipment Index ($DJUSCT) has fallen 5% in less than two weeks, but is somewhat defensive in nature and it's approaching a key price support level. If you're considering a trade on the long side, this group could offer up a solid reward to risk environment given the following support level:
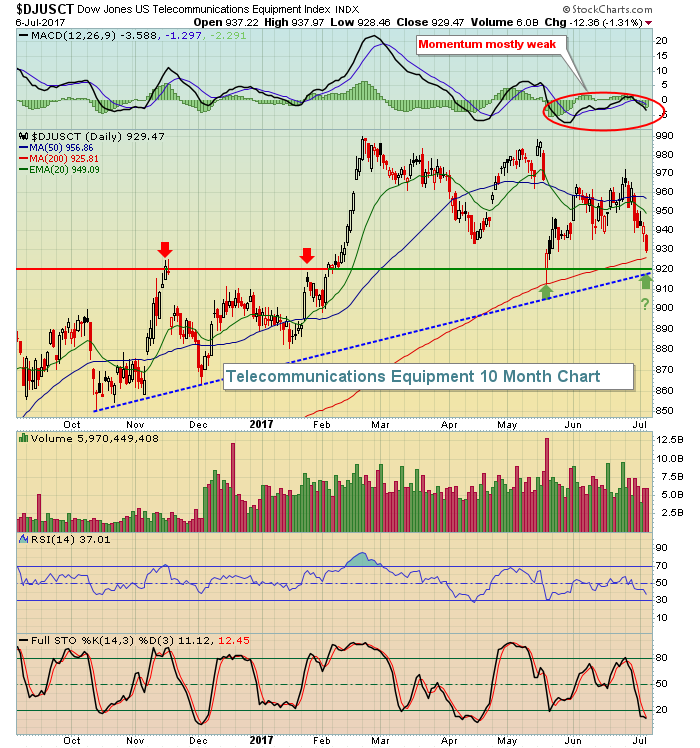 There appears to be a lot of support near 920 - in terms of both price and trendline support. It also doesn't hurt that the 200 day SMA is currently at 925 to provide further technical support. Failure to hold 920 would be a problem, however, given that price momentum is weak as evidenced by the MACD below zero.
Historical Tendencies
Today is July 7th and the 7th to 10th of the calendar month tend to represent a period of profit taking historically. Since 1950 on the S&P 500, the annualized return of this four day period (of every month, not just July) is -5.67%.
Key Earnings Reports
None
Key Economic Reports
June nonfarm payrolls released at 8:30am EST: 222,000 (actual) vs. 170,000 (estimate)
June private payrolls released at 8:30am EST: 187,000 (actual) vs. 164,000 (estimate)
June unemployment rate released at 8:30am EST: 4.4% (actual) vs. 4.3% (estimate)
June average hourly earnings released at 8:30am EST: +0.2% (actual) vs. +0.3% (estimate)
Happy trading!
Tom


