Market Recap for Friday, July 14, 2017
JPMorgan (JPM), Citigroup (C), PNC Financial (PNC) and Wells Fargo (WFC) were a formidable sample of bank stocks ($DJUSBK) reporting earnings last Friday and it was set up to be a very interesting trading day - to see if the huge run up in the DJUSBK was justified. JPM, C and PNC all reported beats on both their top and bottom lines. WFC beat its EPS expectations. But the DJUSBK fell nearly 1% and was a primary reason why financials (XLF, -0.44%) was the only sector to finish Friday's action in negative territory. What gives? Well, there's a very old and wise Wall Street adage that says "buy on the rumor, sell on the news". The DJUSBK rose from just below 390 to just above 430 from early June to early July. Huge expectations were already built into bank stocks as traders anticipated great results. After receiving exactly what they expected, and with nice profits in hand, astute traders sold on the news. The most important aspect, as far as I'm concerned, is whether technical support levels held on the profit taking.....and they did. Here's the chart:
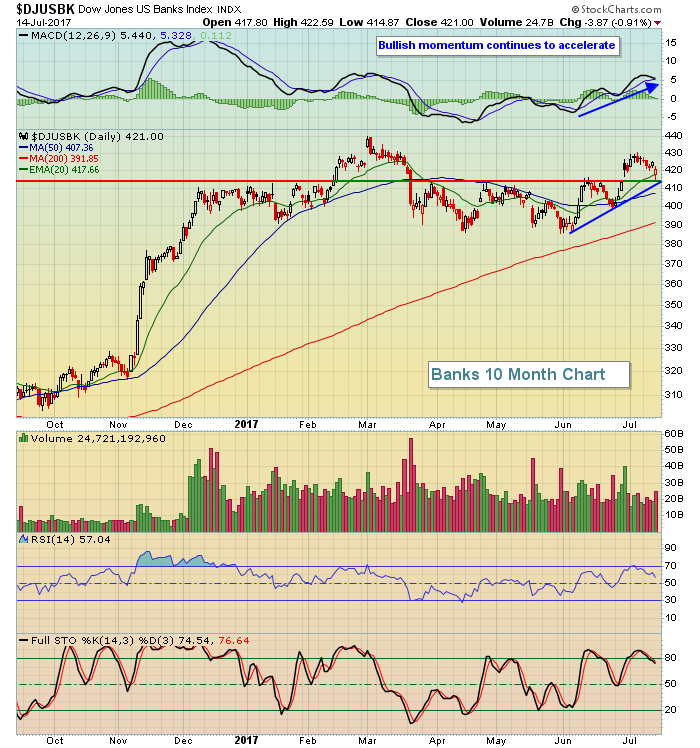 There have been many tops in the 410-415 range so after breaking above that range, we want to see that new support hold. Also, note the rising 20 day EMA is at 417 and short-term trendline support intersects close to 415 as well. After early selling and an intraday move below 415, the DJUSBK recovered and held all of these key support levels. That's a bullish development despite the weak Friday performance.
While financials lagged, our major indices all finished with gains, including another all-time high close for both the Dow Jones and benchmark S&P 500. The big problem currently is that bullish momentum has weakened considerably on both of these indices on a weekly basis, which is reflected in the Current Outlook section below.
Transports ($TRAN) have been strengthening, especially its ratio vs. the Dow Jones Utilities ($TRAN:$UTIL). However, a big component of the transports - railroads ($DJUSRR) - continues to show significant technical deterioration on its weekly chart despite its highest weekly close ever on Friday. You can see this technical deterioration in the Sector/Industry Watch section below.
Pre-Market Action
Asia was mixed overnight. Europe is mixed this morning. Crude oil ($WTIC) is down slightly. Gold ($GOLD) is trying to recover from its recent selling. Earnings reports will accelerate later this week and next. Economic news (empire state manufacturing) was weaker than expected this morning. And momentum has been slowing to the upside. With that under its belt, Dow Jones futures are up 4 points as we open a fresh trading week in 30 minutes.
Current Outlook
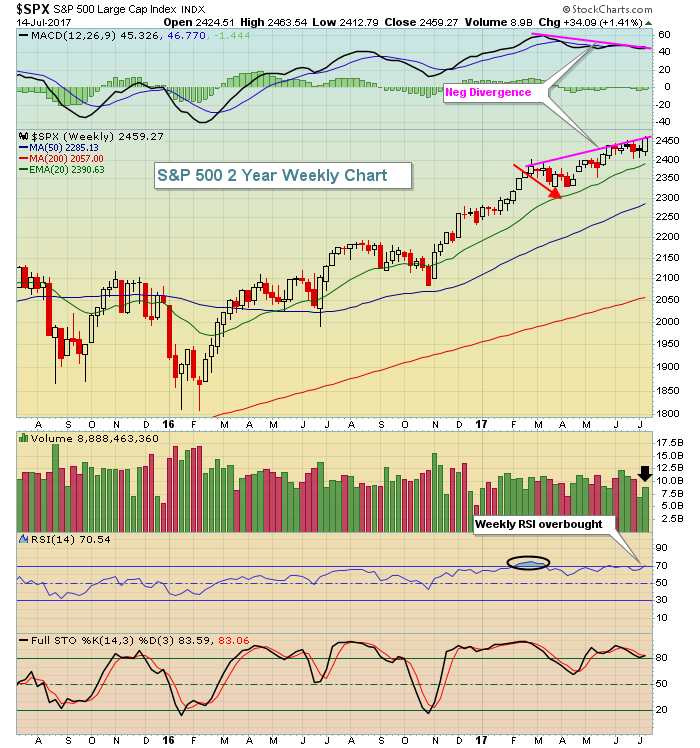
You have to wonder if the weakening weekly momentum will become a problem for the U.S. stock market as it enters its most difficult seasonal period of the year. Since 1950, July 18th to September 27th has proven to be the most difficult time of the year for the S&P 500 to advance and we've seen many instances of 10%+ declines during this period - as I described in Friday's Trading Places blog article. As a reminder, here's how the weekly chart has set up:
 The issues are as follows:
1. Weekly RSI is overbought above the 70 level. This doesn't happen often as you can see from the above. In fact, the last time we saw the weekly RSI push above 70, it resulted in roughly a 3% pullback (red directional arrow)
2. Last week's all-time high close was accompanied by less than stellar volume (black arrow) so the slowing momentum isn't just in terms of price. The low volume breakout appears to confirm the lack of interest from buyers right now.
3. Weekly negative divergences are never a good thing. While they provide us no guarantees of lower prices in the days and weeks ahead, they absolutely suggest that risks of remaining long or adding to positions are quite high.
Sector/Industry Watch
Railroads ($DJUSRR) continue to show weakening momentum, much like the overall S&P 500. Here's a chart to highlight the momentum issue:
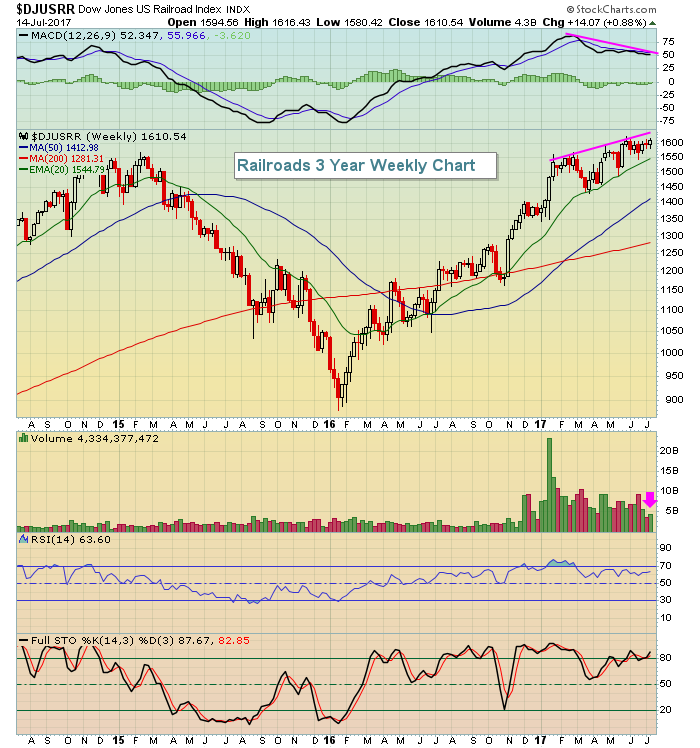 Similar to the S&P 500, volume last week was light as the DJUSRR closed at an all-time weekly high. Be very careful if a bearish candle forms this week (ie, inverted hammer, shooting star, bearish engulfing, dark cloud cover, etc)
Monday Setups
I have several potential setups for this week, which I'll discuss during MarketWatchers LIVE (starts at noon EST) and can be found under "Webinars" from your member dashboard. But here's one that's beginning to look particularly attractive from a reward to risk perspective:
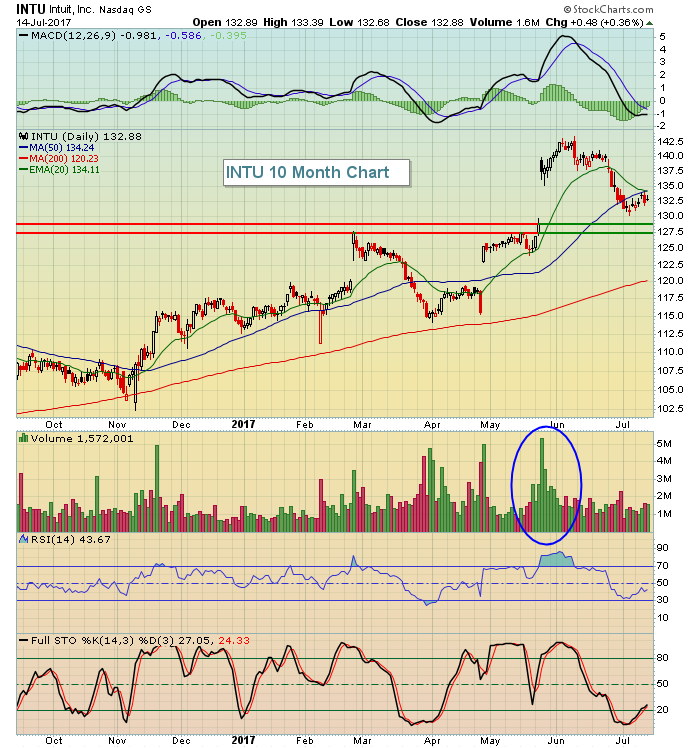 I love the accumulation that took place with the gap-related, heavy volume move higher in late May and early June. The problem at that time was that INTU became extremely overbought with its RSI soaring into the upper 80s. That's very stretched and the lighter June selling helped to relieve the overbought RSI. While there's a chance we see a move lower to 127.50-128.50, I'd use the current price down to that area as an opportunity to build a long position with a closing stop beneath 125.00. My target would be the recent high close to 142.50.
Historical Tendencies
Watch for a technical breakout in Activision Blizzard Inc. (ATVI) because strength this summer would be supported by very strong historical tailwinds. First, let's take a look at the bullish technical outlook:
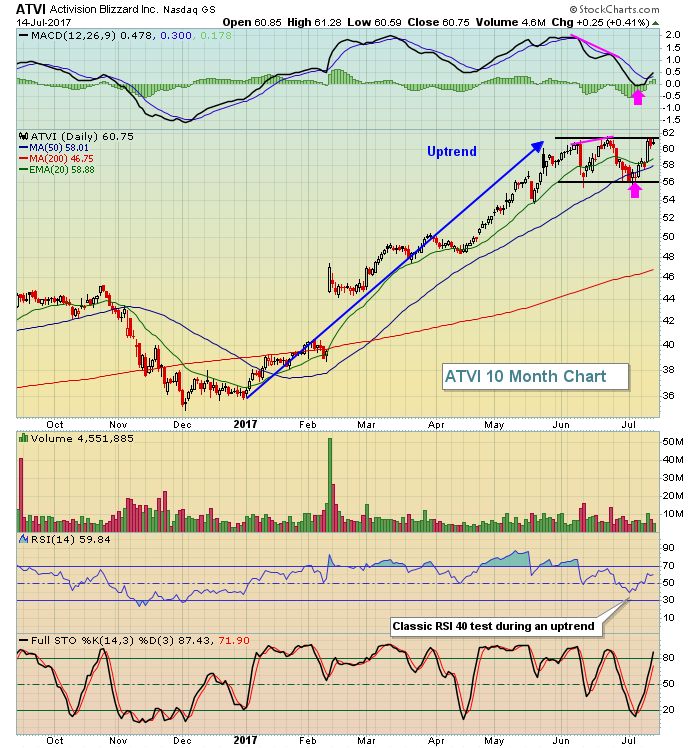 The technical patterns that evolved above are textbook-quality. ATVI was extremely overbought recently, spending most of May and early June with an RSI above 70. It printed a negative divergence in mid-June, then consolidated in a bullish rectangular (flag) pattern while its RSI fell back to 40 - typically great support during an uptrend. The negative divergence unwound with both a 50 day SMA test and a MACD centerline test. Now we see the MACD on the rise again as ATVI bumps up against overhead price resistance. Now for the seasonal pattern:
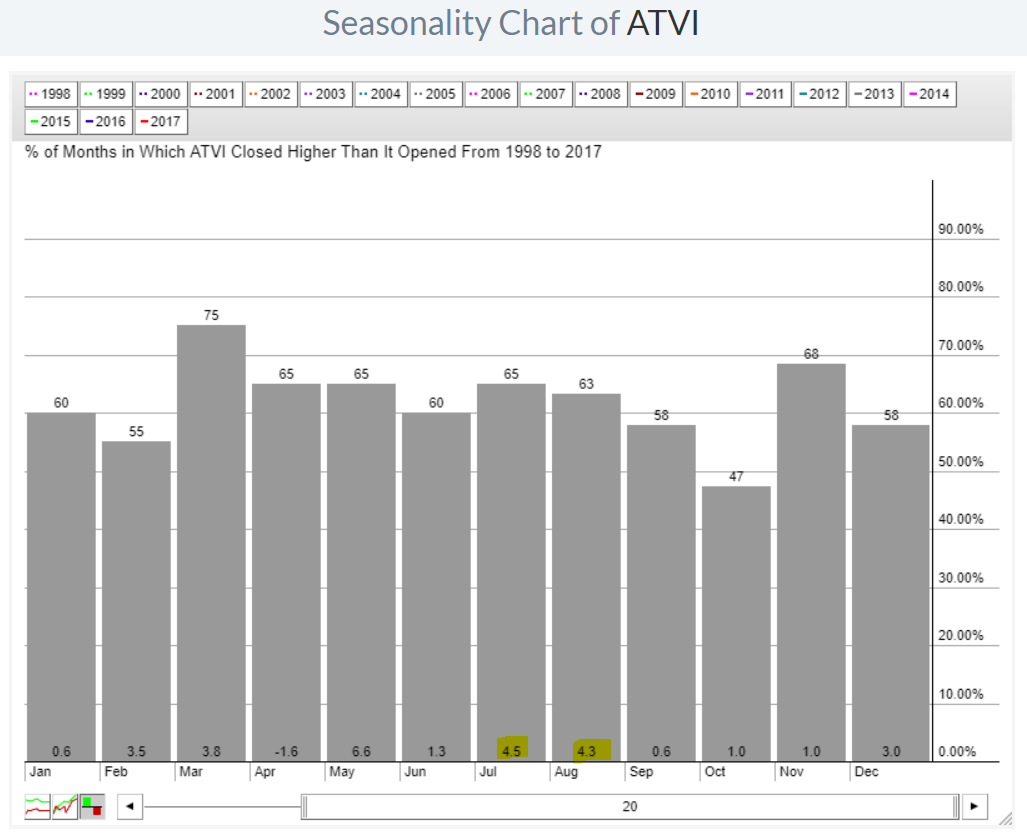 July and August mark the two best consecutive historical months for ATVI in terms of average monthly performance. Given this seasonal strength, a breakout of a bullish technical formation would be more reliable for a trade in my view.
Key Earnings Reports
(actual vs. estimate):
BLK: 5.24 vs 5.37
JBHT: .88 vs .92
(reports after close, estimate provided):
NFLX: .16
Key Economic Reports
July empire state manufacturing report released at 8:30am EST: 9.8 (actual) vs. 15.0 (estimate)
Happy trading!
Tom


