Market Recap for Monday, July 10, 2017
The NASDAQ and S&P 500 rallied on Monday, posting gains of 0.38% and 0.09%, respectively. The small cap Russell 2000 index was easily the worst performing major index, losing 0.52% on the session. Despite the weakness, the Russell 2000 still remains on the cusp of a very significant breakout after consolidating for months. Here's the chart:
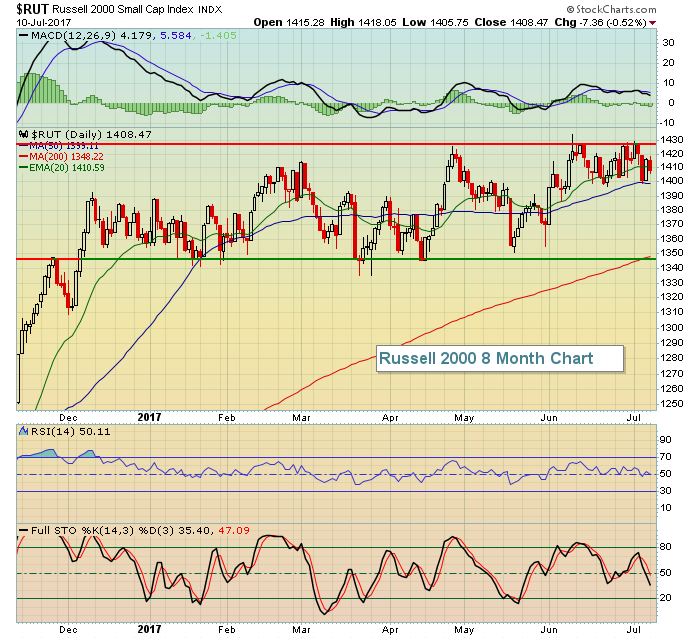 We've been holding nicely above 1400 price support and the rising 50 day SMA is now at 1399 so I'll remain bullish in the near-term as long as this support area holds on bouts of selling. Violation of 1400 support could lead to another test between 1345-1350. That's been critical support throughout 2017.
Five sectors finished higher on Monday, led by technology stocks (XLK, +0.73%). Consumer staples (XLP, -0.70%) was the only sector that showed significant weakness as food retailers & wholesalers ($DJUSFD) fell 1.56%, perhaps still being driven lower by Amazon.com's (AMZN) announcement of their entry into the space with their proposed acquisition of Whole Foods Market (WFM).
Pre-Market Action
U.S. markets are poised for a slightly lower open as Dow Jones futures are down 15 points with a bit more than 30 minutes left to the opening bell. Pepsi Co (PEP) may be setting a solid earnings pace as they beat both revenue and EPS estimates and raised their full year guidance this morning. Despite the solid results, PEP is down fractionally in pre-market and this type of reaction is worth noting, especially if we see the same type of reaction with bank earnings later in the week. Why? Well, it could be that traders believe higher earnings are already priced into equities. It's not always about the earnings results. Many times the reaction is much more important.
ExxonMobil (XOM) was upgraded this morning and XOM represents nearly 23% of the energy ETF (XLE). The reaction to the upgrade has been mild thus far as XOM is currently testing the lower end of its 79.50-83.50 price range that it's been mired in since the beginning of February.
Current Outlook
Industrials (XLI) have seen strength in July, but have bumped up against key price resistance from highs reached on June 19th. In order to provide continuing leadership to the S&P 500, the XLI will need to clear overhead price resistance at the 69.10-69.20 area as follows:
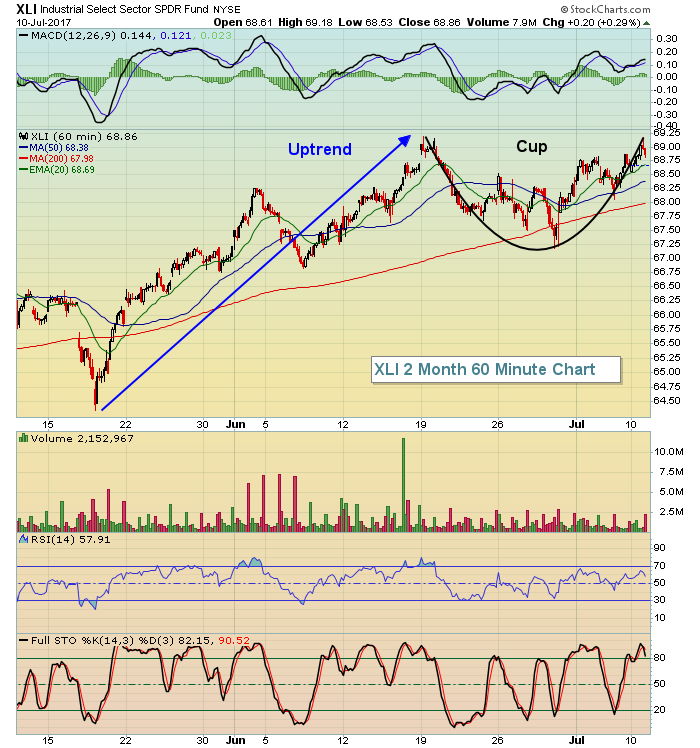 The depth of the cup is roughly 2 dollars from top to bottom so a breakout above 69.20 would measure to approximately 71.20.
Sector/Industry Watch
Gold ($GOLD) has been weakening again, suggesting that the long-term downtrend has taken over, overriding the recent short-term uptrend. The effect is a squeezing triangle pattern that is likely to restrict price movement in both directions until we see resolution. Because the longer-term trend is lower, I'm expecting to see a breakdown rather than a breakout. Take a look:
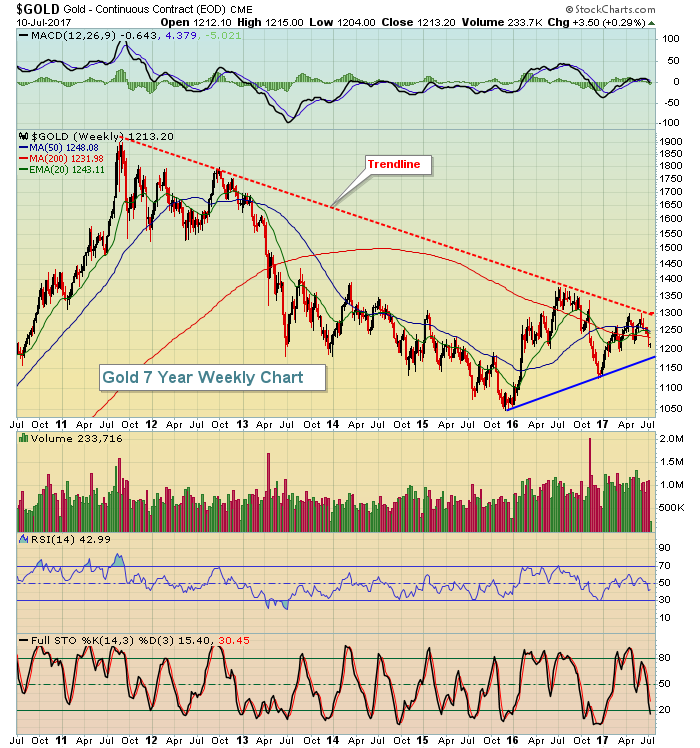 You can see on the above chart that GOLD has tested the 1150-1200 zone on several previous occasions and bounced. The rising short-term trendline now intersects in that same area so a breakdown should be taken seriously, especially since the overall downtrend remains perfectly intact.
Historical Tendencies
Since 1987, the Russell 2000 has risen 14 times during July and fallen 15 times. The annualized return for small caps in July has been approximately -4%, but it's really a tale of two different periods. July 1st-15th has produced annualized returns of +8.50% while July 16th-31st has produced annualized returns of -20.37%.
Key Earnings Reports
(actual vs. estimate):
PEP: 1.50 vs. 1.40
Key Economic Reports
May wholesale inventories to be released at 10:00am EST: +0.3% (estimate)
Happy trading!
Tom


