Market Recap for Monday, August 28, 2017
The U.S. market was able to rally a bit in afternoon trading on Monday and most of our major indices finished in positive territory - the Dow Jones was the lone exception as that index of 30 conglomerates fell 5 points. Sectors were split with healthcare (XLV, +0.53%) the only sector to post decent-sized gains. We did see pockets of strength, however. Home improvement retailers ($DJUSHI) managed to gain close to 1% as the market was anticipating a pick up in demand for stocks in that industry as a result of the devastation caused by Hurricane Harvey in Texas. Also, truckers ($DJUSTK) cleared an important intermediate-term resistance level, tacking on more than 2%. Check out the breakout below:
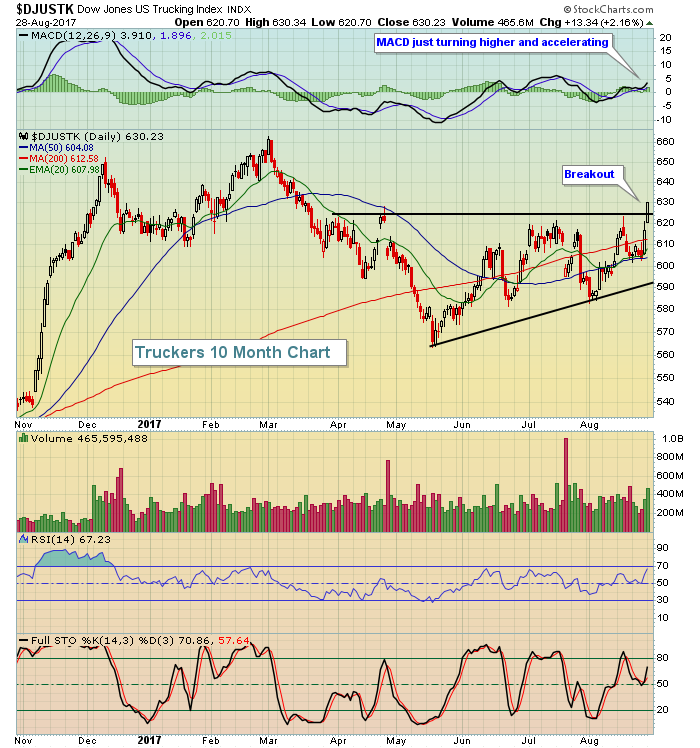 A breakout in trucking will no doubt help the overall transportation group, although I still see some weakness ahead for the group, primarily because of railroads ($DJUSRR) and airlines ($DJUSAR).
The day truly belonged to the biotechs ($DJUSBT) though. This is one of the strongest industry groups currently - in my opinion - as the group has very strong upward momentum in play on its weekly chart. Take a look:
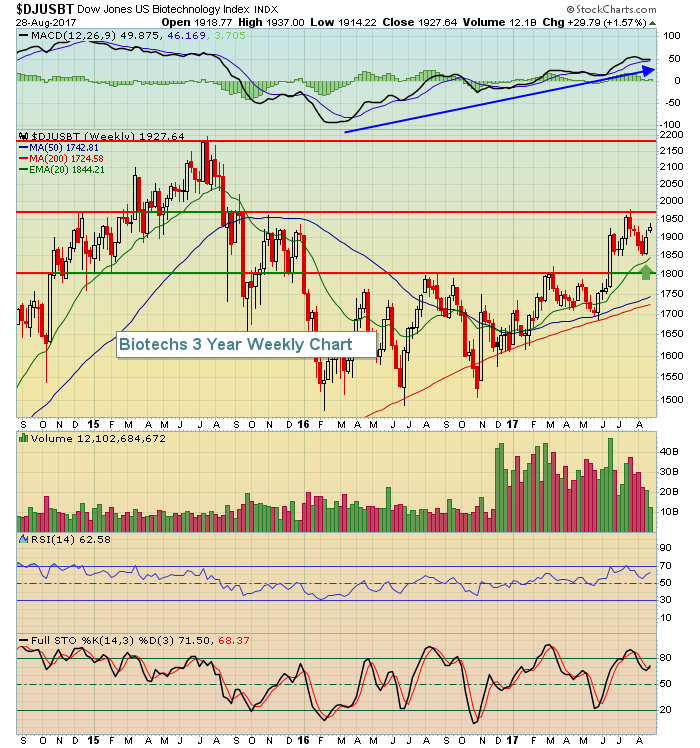 There aren't many places in the U.S. stock market right now where we see prices rising and the weekly MACD rising with it. Also, bouncing at or near rising 20 week EMA support shows very bullish behavior as well. Currently, the DJUSBT is in a trading range from 1800-1970. A breakout above the upper end of that range would likely signal an upcoming test of the 2015 high near 2200.
Pre-Market Action
North Korean threats are spooking investors and that concern can be seen in global equity markets. Most of Asia was lower with the China Shanghai ($SSEC) one slight exception. In Europe this morning, all the major indices are getting slammed with the German DAX ($DAX) down more than 200 points and trading below 11900 for the first time since March. That does not bode well for S&P 500 performance here.
The 10 year treasury yield ($TNX) has fallen to 2.10% and gold ($GOLD) is thriving, one day after breaking above key price and long-term trendline resistance (1300). I've been bearish gold for the past several years, but it's difficult to ignore the significance of the 1300 breakout - or the breakdown in the U.S. Dollar ($USD), now trading at its lowest level since 92 was tested in early May 2016.
Dow Jones futures are tumbling 118 points this morning as we approach a new trading day.
Current Outlook
While the Volatility Index ($VIX) remains well below its highs from early August, we remain in an overall short-term uptrend and that provides the bears hope in the near-term:
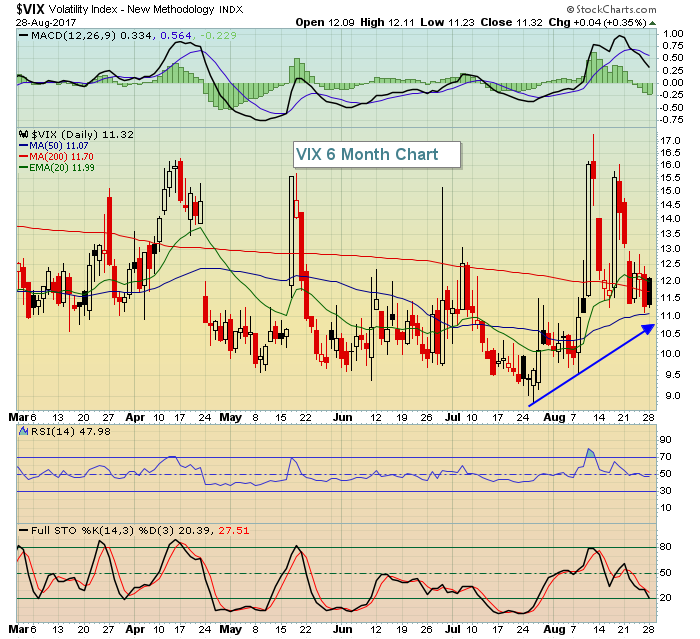 Rising volatility is the environment where bears can thrive. I would certainly expect another surge in the VIX given the weak U.S. futures this morning. Keep a very close eye on recent price support levels on our key U.S. indices (recent price lows) as violations of these levels could escalate the near-term bearishness and selling.
Sector/Industry Watch
While biotechs enjoyed an awesome day on Monday, other areas of healthcare struggled to clear key price and moving average resistance. For instance, the Dow Jones U.S. Medical Supplies Index ($DJUSMS), which still looks fairly solid on the longer-term weekly charts, was unable to penetrate resistance on its daily chart as reflected below:
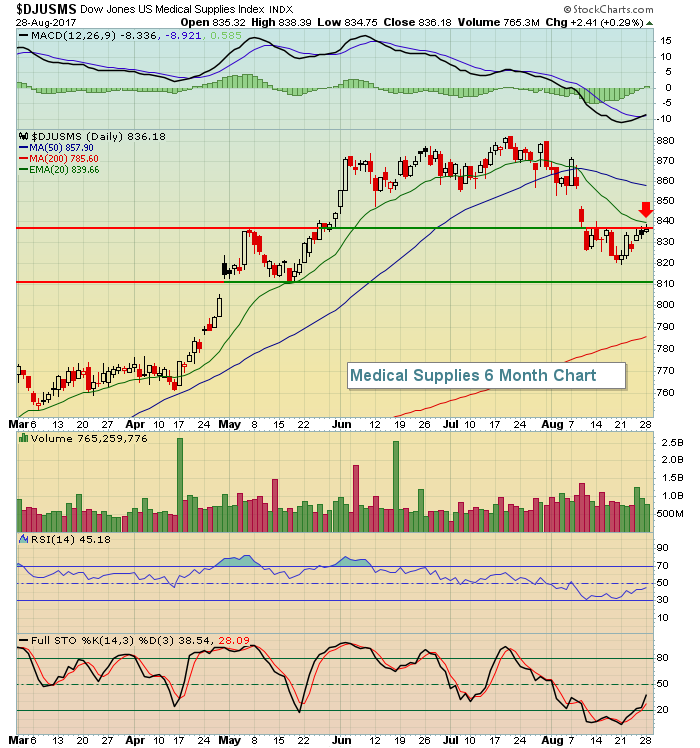 After losing price support a few weeks ago near 837, the DJUSMS has begun to strengthen again, but didn't have enough buyers to clear that 837 level yesterday. Note also that the now-declining 20 day EMA resides at 839, providing additional short-term resistance and sellers.
Historical Tendencies
While both August and September are neutral to bearish months, the next truly bearish period on the NASDAQ begins September 20th. From September 20 through September 27th, the NASDAQ has produced annualized returns of -50.43% since 1971. The other major indices are also bearish during this time and I'll provide more information on that as the period draws closer.
Key Earnings Reports
(actual vs. estimate):
BBY: .69 vs .63
BMO: 1.58 vs 1.54
BNS: 1.26 vs 1.24
(reports after close, estimate provided):
HRB: (.63)
Key Economic Reports
June Case-Shiller home price index to be released at 9:00am EST: +0.3% (estimate)
August consumer confidence to be released at 10:00am EST: 120.6 (estimate)
Happy trading!
Tom


