Market Recap for Monday, July 31, 2017
The Dow Jones set another all-time high on Monday, rising another 60 points in its lone attempt to carry the bull market to new heights. All of our other major indices fell on Monday despite the renewed strength of financials (XLF, +0.72%). Home Depot (HD) was the leading component and the only stock in the Dow Jones to gain more than 1%. HD may struggle to lead the Dow much further, however, as price and volume trends have both turned south. Check out the latest HD chart:
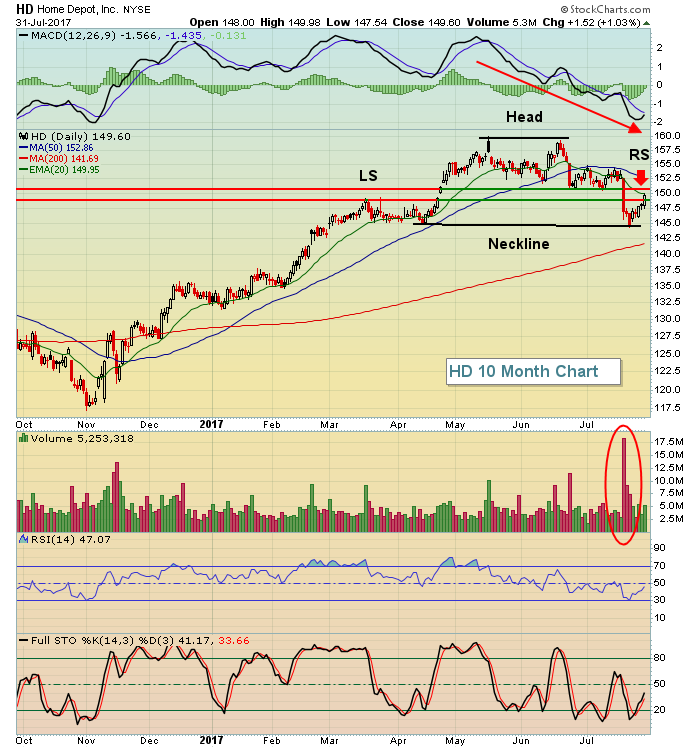 The volume exploded to lose price support just above 150 and establish the right side of a possible head & shoulders neckline. The gain yesterday moved into a price resistance zone from 149-151 and is tested the now-declining 20 day EMA. And the MACD? Awful. Anything is possible, but the short-term technical issues here are glaring.
Banks ($DJUSBK) bounced nicely on Monday, helping financials move to the top of the sector leaderboard. While the gains weren't huge, the push higher did occur from both gap and price support - exactly where the bulls needed to appear:
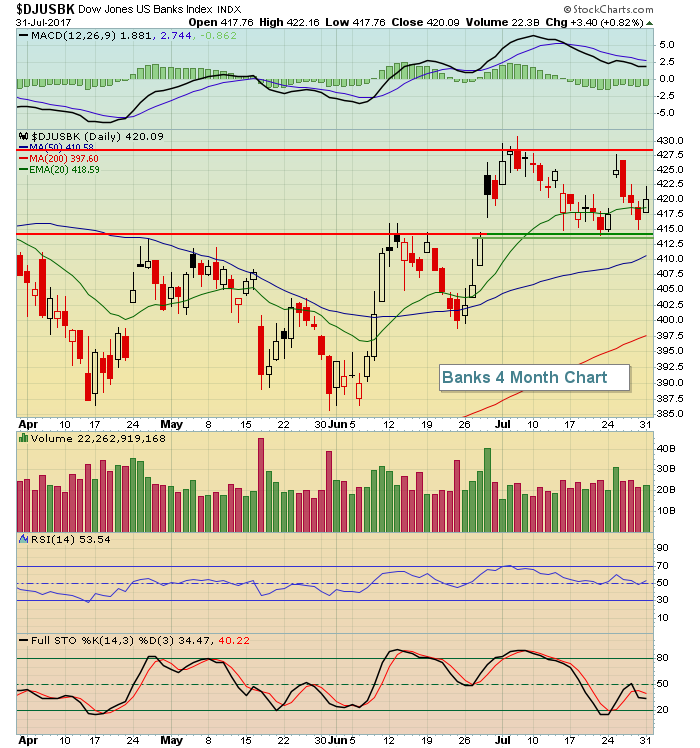 Another bounce from Friday's low firmly establishes the short-term trading range on banks as 413-429.
Pre-Market Action
Crude oil ($WTIC) managed to close above $50 per barrel yesterday for the first time in more than two months. There's a bit of profit taking this morning as it's slipped just beneath that psychological level. Gold ($GOLD), which is approaching MAJOR trendline and price resistance levels, is flat this morning after a steady rise. Its catalyst has primarily been a tumbling U.S. dollar ($USD).
Overnight, the Hang Seng Index ($HSI) soared once again and is quickly approaching its 2015 high. Other key Asian markets were higher as well. In Europe this morning, we're seeing gains of 0.75%-0.80% throughout most of the key indices there.
Dow Jones futures are up nearly 100 points as traders await Apple's (AAPL) quarterly results after the bell this afternoon.
Current Outlook
From a longer-term weekly perspective, I continue to believe that healthcare is the best sector alternative as relative strength remains quite strong and bullish momentum is accelerating - and that can't be said for any of our aggressive sectors. Healthcare isn't without its own technical issues, however, with most of them being on the daily chart:
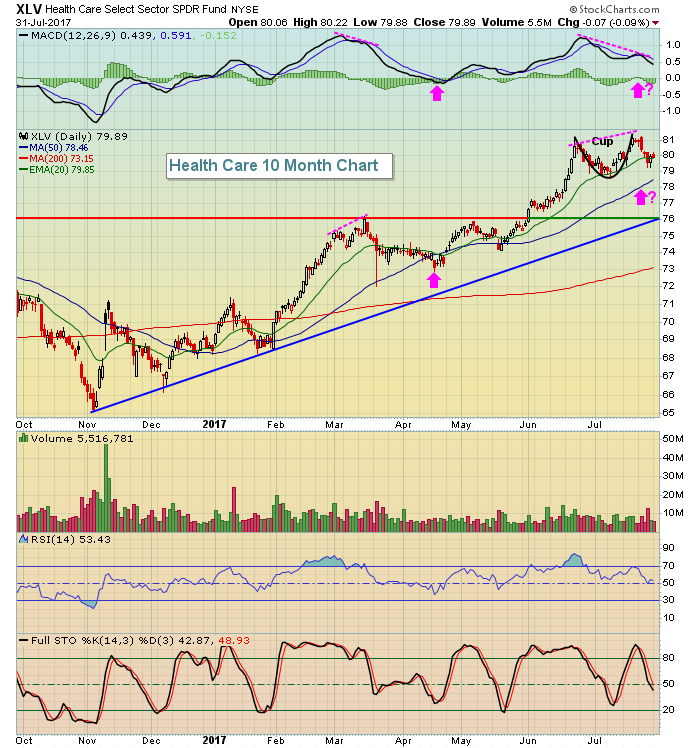 While an argument can be made that the XLV is currently reflecting a bullish cup with handle pattern, the negative divergence gives me reason to pause. We saw a similar negative divergence emerge in mid-March and the XLV was stymied for the next month as the momentum issues unwound and resulted in both 50 day SMA and MACD centerline tests. The group could be in for a similar fate this summer. Still, this sector chart looks as solid as any on a longer-term weekly chart and that could prove more meaningful than the short-term momentum issues that currently appear. Because the long-term remains so bullish, I'd use any short-term weakness in the XLV over the next few weeks to accumulate either this ETF or your favorite healthcare stocks.
Sector/Industry Watch
Food retailers & wholesalers ($DJUSFD) jumped more than 2% on Monday, led by Costco's (COST) advance. Both the DJUSFD and COST have printed positive divergences so the spike above their 20 day EMAs suggest a 50 day SMA test could be underway.
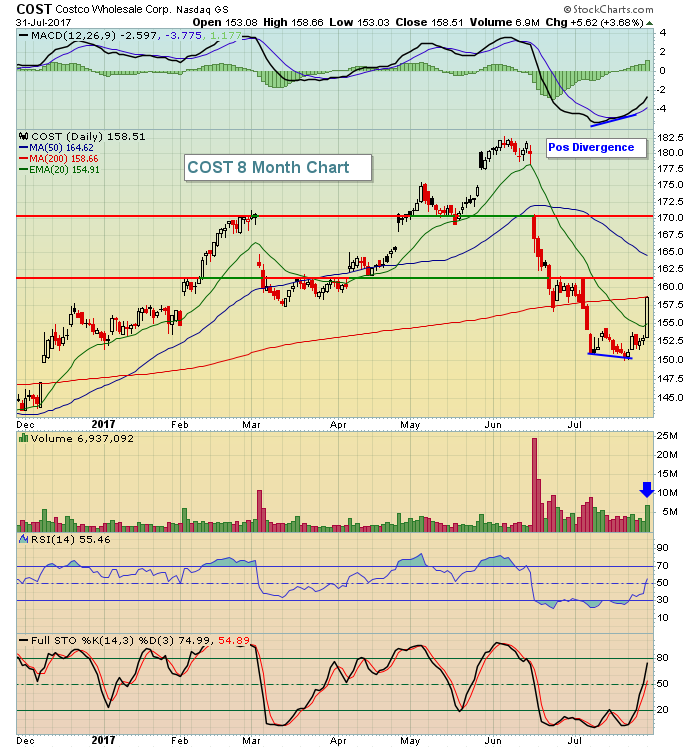 COST still has plenty of technical obstacles, but the increase in volume and surge above its 20 day EMA with a positive divergence tailwind will likely take the stock up to challenge its first key overhead price resistance near 161.50. There was plenty of distribution/selling that took place at that level so it wouldn't be a shock to see sellers line up there once again. A close above that level, however, could open the doors for a MAJOR price test just above 170. That's where COST tumbled after Amazon.com (AMZN) announced its plans to buy Whole Foods Market (WFM).
Historical Tendencies
I mention this often, but the first calendar day of the month is the most bullish historically for U.S. stocks. Here are the annualized returns for the first calendar day for each of the following major indices:
S&P 500: +46.17% (since 1950)
NASDAQ: +59.82% (since 1971)
Russell 2000: +43.03% (since 1987)
Today is August 1st.
Key Earnings Reports
(actual vs. estimate):
ADM: .57 vs .52
APD: 1.65 vs 1.60
BP: .21 vs .11
CME: 1.23 vs 1.20
CMI: 2.53 vs 2.58
ECL: 1.13 vs 1.12
EMR: .68 vs .68
ETN: 1.15 vs 1.16
HMC: 1.04 vs .83
INCY: (.06) vs (.08)
PFE: .67 vs .65
PSX: 1.09 vs 1.02
RCL: 1.71 vs 1.67
S: .05 vs (.01)
SNE: .56 vs .48
SPG: 2.47 vs 2.44
TRI: .60 vs .51
(reports after close, estimate provided):
AAPL: 1.57
ALL: .90
EOG: .10
FISV: 1.23
ILMN: .68
VRSK: .77
Key Economic Reports
June personal income released at 8:30am EST: +0.0% (actual) vs. +0.4% (estimate)
June personal spending released at 8:30am EST: +0.1% (actual) vs. +0.1% (estimate)
July PMI manufacturing to be released at 9:45am EST: 53.2 (estimate)
July ISM manufacturing to be released at 10:00am EST: 56.2 (estimate)
June construction spending to be released at 10:00am EST: +0.5% (estimate)
Happy trading!
Tom


