Special Note
I will be joining John Hopkins, President of EarningsBeats.com, for a special earnings-related webinar that begins at 4:15pm this afternoon, just after the market closes. I'll be providing several of my favorite stocks from the current parade of earnings so please join me and John later today. CLICK HERE for more information and to register for this special event.
Market Recap for Friday, August 4, 2017
The July nonfarm payrolls report came in much better than expected and the U.S. bond and stock markets reacted about as you would expect. The 10 year treasury yield ($TNX) spiked and that led to strength across all of our major indices, with each of them rising. The Russell 2000 showed the most strength, rising 0.50% on the session. Six of the nine sectors also finished higher and the sectors that didn't - healthcare (XLV, -0.23%), consumer staples (XLP, -0.27%) and utilities (XLU, -0.44%) - were all defensive areas.
Financials (XLF, +0.67%) led as life insurance ($DJUSIL) and banks ($DJUSBK) were among the leaders, as you would expect. Two REITs - Retail REITs ($DJUSRL) and Hotel & Lodging REITs ($DJUSHL) - were the top performers.
Pre-Market Action
In pre-market action this morning, both gold ($GOLD) and crude oil ($WTIC) are lower this morning, the latter by slightly more than 1%. Asian markets finished mostly higher overnight, while markets in Europe are somewhat mixed this morning.
As we prepare to open for a fresh new week of trading, Dow Jones futures are set to open higher - up 28 points with 30 minutes left to the opening bell.
Current Outlook
The bounce in treasury yields on Friday came as a result of selling in that defensive asset class. That triggered buying of equities, especially in the financial sector where we tend to see appreciating prices with rising yields. The 10 year treasury yield ($TNX) bounced on Friday not only as a stronger than expected jobs report was released, but also because the TNX had hit short-term yield support. Check out the chart:
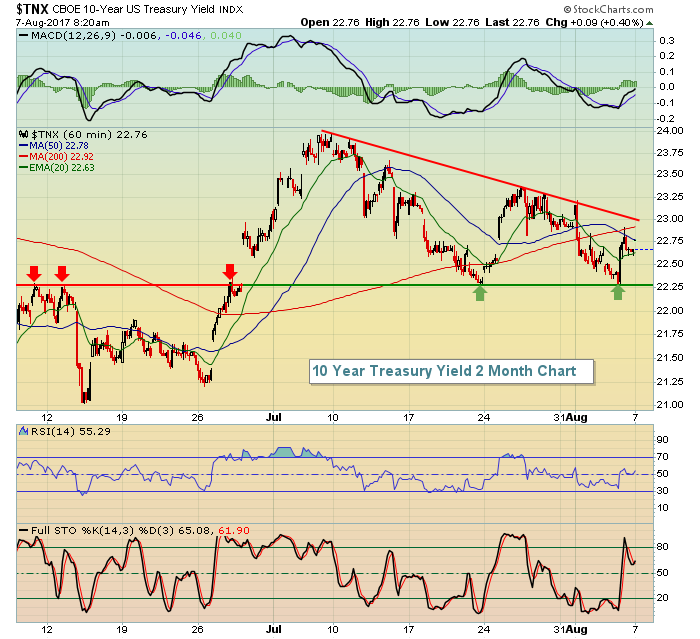 The TNX is currently squeezing into a fairly narrow 2.22%-2.30% range. A break to the upside would be a bullish signal for equities as rising yields mean treasury proceeds (from sales) to be invested in the stock market. A breakdown, on the other hand, would likely mean short-term bearish consequences for U.S. equities.
Sector/Industry Watch
After five weeks of poor performance following a nasty negative divergence on its weekly chart, the Dow Jones U.S. Mobile Telecommunications Index ($DJUSWC) has re-established an uptrend and now appears likely to revisit its earlier May high. Check it out:
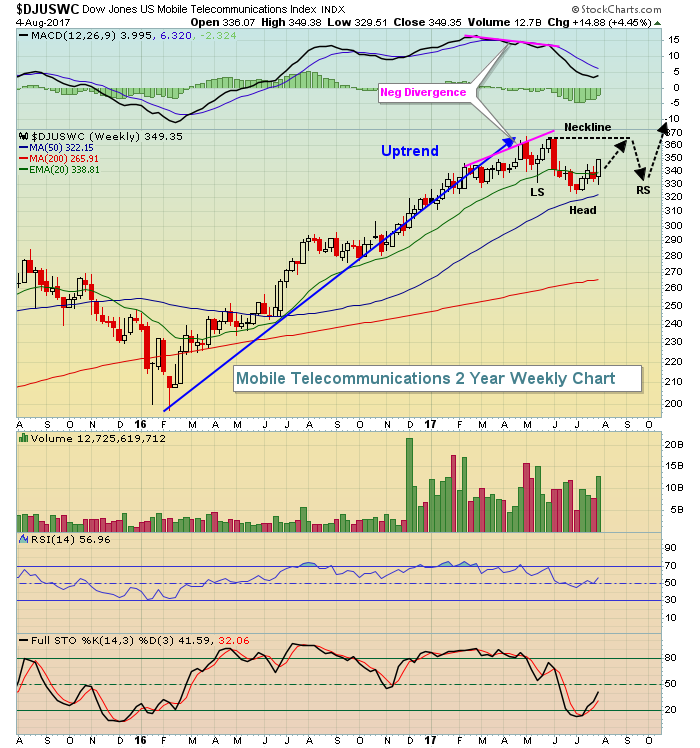 Typically, negative divergences result in MACD centerline tests and/or 50 period SMA tests. In this case, the DJUSWC turned higher before we saw either. However, the DJUSWC had not fallen below its rising 20 week EMA for over a year until that negative divergence surfaced. Then we saw this index trade beneath its 20 week EMA for most of the next seven weeks prior to last week's solid move back above that key moving average. The MACD, in the meantime, dropped from approximately 17 to around the 3 level. While that wasn't a literal centerline test, we saw much of the momentum in the group fade. I believe the new uptrend can be trusted - with the first significant issue being a weekly close back beneath its 20 week EMA.
The above chart highlights a "possible" bullish inverse head & shoulders continuation pattern forming. There's still plenty that needs to happen, but the black directional arrows indicate what "could" happen and something to look for.
Monday Setups
I try to stay consistent in my approach to trading and to finding trading candidates. I generally only trade stocks that have beaten Wall Street revenue and EPS estimates. Call me crazy, but I like to invest in companies where management is executing their business plan successfully. Second, I won't chase huge gaps higher with big earnings reports. Instead, I place them in a ChartList and I wait. And I wait. And I wait. And I wait. My favorite stock trades are companies that meet the above earnings qualification and then hit price support with an RSI reading typically in the 40-50 zone. Like buying anything else, I want to buy my stocks "on sale".
Blackhawk Network Holdings (HAWK) is one such stock. Is it a guaranteed winning trade if bought right now? Of course not. There are no guarantees and one rule of trading is to make sure you keep a stop in place - either a mental stop if you're able to follow your positions throughout the trading day....or a physical stop if you cannot. Let's take a look at HAWK:
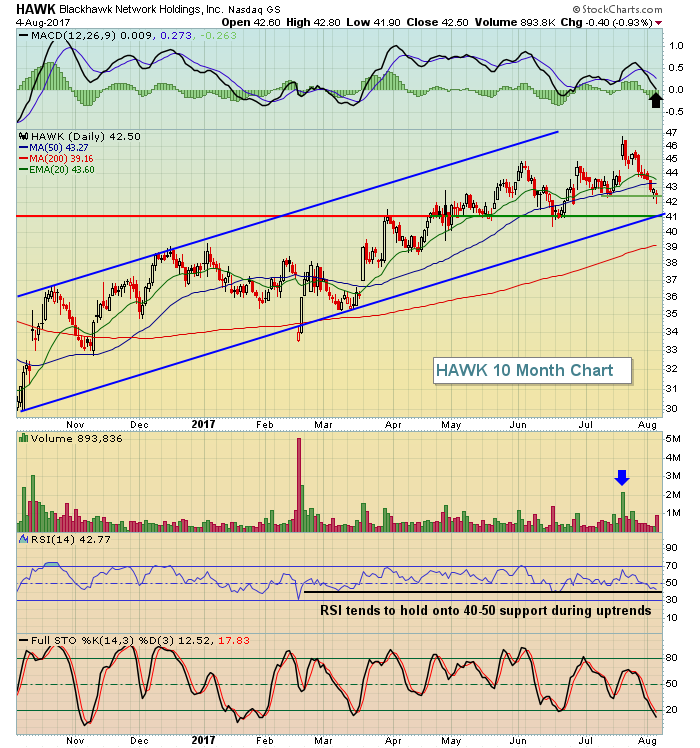 I like accumulating HAWK in the 41.00-42.50 area and Friday's candle was a bullish reversal off near-term price support. For aggressive traders, consider entering at the current level and again at 41.00 with a closing stop beneath 40.75. I'd also consider a target of 46.00-46.50.
Historical Tendencies
From a calendar month perspective, today marks the beginning of a profit taking period. On the NASDAQ, the following represents the annualized returns since 1971 by calendar day of the month:
August 7: -11.36%
August 8: +2.52%
August 9: -19.89%
August 10: +4.80%
Even though the 8th and 10th have produced positive results, keep in mind the S&P 500 has averaged returning 9% per year over the past 67 years. So each of the above days produces annualized returns well below average.
Key Earnings Reports
(actual vs. estimate):
FDC: .34 vs .34
SCCO: .39 vs .42
TSN: 1.28 vs 1.27
(reports after close, estimate provided):
ALB: 1.11
CBS: .97
MAR: 1.02
PAA: .26
Key Economic Reports
None
Happy trading!
Tom


